2023 MED QSR WEB SITE INDEX

Socioeconomic characteristics
Ecological Footprint
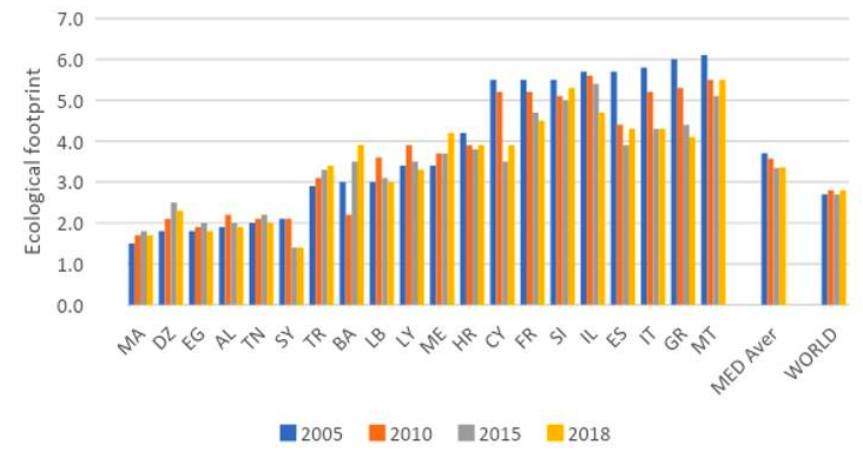
64. The ecological deficit in the Mediterranean countries is twice as high as the global average, meaning that Mediterranean countries consume approximately 2.5 times more natural resources and ecological services than the region’s ecosystems can provide (Akcali et al, 2022). The gap between the Mediterranean and the world averages remained substantial: an Ecological Footprint5 of 3.4 global hectares per capita is found in the Mediterranean, as compared to 2.8 globally in 2018.
65. Ecological Footprint ranges from 1.1 to 5.5, with ecological deficits assessed for all Mediterranean countries. Countries with the highest ecological deficit are the two island states (Malta and Cyprus), but also Israel, Italy and Slovenia. Over the past 15 years, the Ecological Footprint has been mainly on the rise in southern and eastern Mediterranean countries (SEMC), with the exception of Syrian Arab Republic and Libya, as well as in Bosnia and Herzegovina and Montenegro, and declining in the EU Mediterranean countries, most notably in Cyprus, Spain, Italy and Greece, as well as in Israel. A slight decline was also seen in other EU countries, whereas stagnation was recorded in Egypt, Albania and Tunisia.
5
5 The Ecological Footprint measures how much biocapacity humans demand, and how much is available. It does not address all aspects of sustainability, nor all environmental concerns. Biocapacity is the area of productive land available to produce resources or absorb carbon dioxide waste, given current management practices. Global hectares (gha) is a unit of world-average bioproductive area, in which the Ecological Footprint and biocapacity are expressed.
Figure 6: Ecological Footprint of the Mediterranean countries 2005 – 2018.
Source: Global Footprint Network, York University, FoDaFo (2022). National Footprint and Biocapacity Accounts, 2022 Edition.
Human development and gender equality
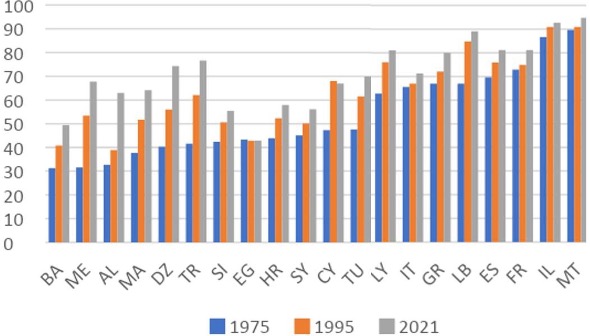
66. Sixteen Mediterranean countries rank at or above the world average of human development as measured by the HDI (world average of 732). Countries with the highest HDI values include Israel, the EU Mediterranean and Western Balkan countries and Türkiye, followed by Algeria, Egypt and Tunisia. Libya, Lebanon, Morocco and the Syrian Arab Republic have HDIs lower than the world average, ranking between 104th and 150th.
Table 2: Human development and gender inequality indexes (GII) with related indicators, 2021. SDG: Sustainable Development Goals
|
Countries |
Human Develop ment Index (value) |
HDI rank |
Mean years of schooling (SDG 4.4) | Gender inequality index (value) |
GII rank |
Adolescent birth rate a) (SDG 3.7) |
Share of parliament seats held by women (SDG 5.5) |
| AL | 0.796 | 67 | 11.3 | 0.144 | 39 | 14.5 | 35.7 |
| DZ | 0.745 | 91 | 8.1 | 0.499 | 126 | 11.7 | 7.5 |
| BA | 0.780 | 74 | 10.5 | 0.136 | 38 | 9.9 | 24.6 |
| HR | 0.858 | 40 | 12.2 | 0.093 | 26 | 8.6 | 31.1 |
| CY | 0.896 | 29 | 12.4 | 0.123 | 35 | 6.8 | 14.3 |
| EG | 0.731 | 97 | 9.6 | 0.443 | 109 | 44.8 | 22.9 |
| FR | 0.903 | 28 | 11.6 | 0.083 | 22 | 9.5 | 37.8 |
| GR | 0.887 | 33 | 11.4 | 0.119 | 32 | 8.5 | 21.7 |
| IL | 0.919 | 22 | 13.3 | 0.083 | 22 | 7.6 | 28.3 |
| IT | 0.895 | 30 | 10.7 | 0.056 | 13 | 4.0 | 35.3 |
| LB | 0.706 | 112 | 8.7 | 0.432 | 108 | 20.3 | 4.7 |
| LY | 0.718 | 104 | 7.6 | 0.259 | 61 | 6.9 | 16.0 |
| MT | 0.918 | 23 | 12.2 | 0.167 | 42 | 11.5 | 13.4 |
| MC | — | — | – – | — | — | — | — |
| ME | 0.832 | 49 | 12.2 | 0.119 | 32 | 10.4 | 24.7 |
| MA | 0.683 | 123 | 5.9 | 0.425 | 104 | 25.9 | 20.4 |
| SL | 0.918 | 23 | 12.8 | 0.071 | 18 | 4.5 | 21.5 |
| ES | 0.905 | 27 | 10.6 | 0.057 | 14 | 6.3 | 42.3 |
| SY | 0.577 | 150 | 5.1 | 0.477 | 119 | 38.7 | 11.2 |
| TN | 0.731 | 97 | 7.4 | 0.259 | 61 | 6.7 | 26.3 |
| TR | 0.838 | 48 | 8.6 | 0.272 | 65 | 16.9 | 17.3 |
| WORLD | 0.732 | –– | 8.6 | 0.465 | –– | 42.5 | 25.9 |
NOTES: a) Births per 1,000 women ages 15–19.
Source: https://hdr.undp.org/data-center/documentation-and- downloads (accessed November 2022).
67. Women disproportionately suffer the impacts of climate change and other environmental hazards, especially in developing To achieve inclusive sustainable development, it is vital to achieve gender equality. A gender gap persists in all Mediterranean countries. Gender inequality, as measured by the Gender inequality index (GII)6, is highest in Algeria, Syrian Arab Republic, Egypt, Lebanon and Morocco. Mediterranean countries that get closest to gender equality, without however reaching equality, are Italy, Spain and Slovenia. A third or more seats in the national parliaments are held by women in just a few countries – Spain, France, Albania and Italy (SDG indicator 5.5). Among the SEMC, relatively high participation of women in the national assemblies is found in Israel, Tunisia, Egypt and Morocco. The share of female members of parliament is relatively low in Cyprus and Malta. The highest adolescent birth rates (SDG indicator 3.7) are found in Egypt.
6
6 GII is a composite metric of gender inequality using three dimensions: reproductive health, empowerment and the labour market. A low GII value indicates low inequality between women and men, and vice-versa.
Population as a multiplier of pressures on the coastal and marine environment
68. Population in the Mediterranean countries reached 7 million in 2021, increasing by close to 20 million people in only 3 years between 2018 and 2021 (UN DESA Population Division, 2022). An overall increase of 41.4% was recorded between 1990 and 2021, while decade-on-decade growth accelerated (from a rate of 12.5% between 1990 and 2000, to 13.5% between 2000 and 2010 and 17.2% for the last decade). Human-caused pressures on the coastal and marine environment are stemming from unsustainable production and consumption patterns, and a growing population multiplies these pressures, unless incremental population increase comes with sustainable lifestyles.
69. The most populated countries are Egypt (109.3 million in 2021) followed by Türkiye (84.8 million), France (64.5 million), Italy (59.2 million) and Spain (47.5 million). Montenegro, Malta and Monaco count less than a million inhabitants. Monaco is the most densely populated country with 24,622 inhabitants per square Other densely populated countries are Malta, countries of the east Mediterranean coast (Lebanon and Israel), and Italy. Low population density (of 100 inhabitants per km2 or less) is found in Spain, Morocco, Greece, Tunisia, Croatia, Bosnia and Herzegovina, Montenegro, Algeria (18 inhabitants/ km2) and Libya (4 inhabitants/ km2). These are national averages, and it must be noted that settlements tend to concentrate in the coastal zones of Mediterranean countries, where population density is thus generally higher than the national average. In this sense, population can be seen as a concentrator of human pressures on the coastal and marine environment.
Table 3: Key demographic data, 2021
|
Countries |
Median age of population (years) |
Population change prev. yr., (in 000) |
Population density (inhab./ km2) |
Total population (in 000) | Popul. % change ‘21/’01 | Total net- migration (in 000) | |
| AL | 37.27 | -13.71 | 104.19 | 2,854.71 | -9.5 | -10.61 | |
| DZ | 27.80 | 731.25 | 18.55 | 44,177.97 | 41.6 | -18.80 | |
| BA | 41.82 | -49.80 | 63.89 | 3,270.94 | -22.0 | -25.87 | |
| HR | 43.73 | -37.93 | 72.64 | 4,060.14 | -9.9 | -10.40 | |
| CY | 37.59 | 5.78 | 134.65 | 1,244.19 | 29.0 | 2.00 | |
| EG | 23.94 | 1,741.26 | 109.76 | 109,262.18 | 50.0 | -32.37 | |
| FR | 41.59 | 58.20 | 117.04 | 64,531.44 | 9.3 | 20.61 | |
| GR | 44.74 | -71.51 | 79.85 | 10,445.37 | -5.7 | -14.81 | |
| IL | 29.04 | 141.35 | 411.22 | 8,900.06 | 42.7 | 16.86 | |
| IT | 46.83 | -241.86 | 200.15 | 59,240.33 | 3.9 | 28.02 | |
| LB | 28.27 | -77.39 | 546.69 | 5,592.63 | 27.4 | -115.12 | |
| LY | 26.27 | 78.84 | 4.02 | 6,735.28 | 27.7 | -0.70 | |
| MT | 39.01 | 11.25 | 1,672.22 | 526.75 | 31.0 | 10.41 | |
| MC | 54.52 | -0.25 | 24,621.48 | 36.69 | 13.1 | 0.21 | |
| ME | 38.19 | -0.69 | 45.46 | 627.86 | -0.8 | -0.10 | |
| MA | 28.67 | 375.77 | 83.08 | 37,076.59 | 28.2 | -46.24 | |
| SL | 43.20 | 0.76 | 105.24 | 2,119.41 | 6.9 | 4.57 | |
| ES | 43.88 | 178.55 | 94.53 | 47,486.94 | 15.9 | 275.02 | |
| SY | 20.94 | 530.44 | 116.08 | 21,324.37 | 27.5 | 212.19 | |
| TN | 31.74 | 91.50 | 78.90 | 12,262.95 | 22.7 | -9.19 | |
| TR | 30.93 | 632.46 | 110.15 | 84,775.40 | 30.3 | -69.73 | |
| TOTAL MED | 531,685.56 | 24.3 | |||||
Source: UN DESA, Population Division (2022); own calculations
70. Decreases in population (on a year-by-year basis) have been recorded for some time sequences or the entire period since 2000 in some of the Mediterranean countries. The downward population trend has been most consistent in Albania, Bosnia and Herzegovina (since 2002), Croatia (since 2005) and Montenegro (almost all years in the observed period), as well as in Greece (since 2005). Periodic population decreases during the last 20 years also characterise a few SEMC (Lebanon, Libya, Syrian Arab Republic) and can be correlated with periods of conflicts and crises7. Negative population growth was also seen in Italy (since 2014), Spain (in the period 2012 – 2015) and Monaco. In other Mediterranean countries, annual population changes during the past two decades were positive. With dominantly unsustainable lifestyles that are linked to negative environmental externalities (resource depletion, waste generation, etc.), fluctuations of population generally impact the weight of overall pressures on the coastal and marine environment, at varying levels depending on the per capita environmental footprint.
7
7 E.g., Lebanon since 2015; Libya had a negative population balance of 0.74 million in 2011; Syrian Arab Republic in particular in the period 2012 – 2015.
71. Cumulative population change rates 2001 – 2021 indicate population declined in Bosnia and Herzegovina (-22%), as well as in Croatia, Albania, Greece and Montenegro (by less than 10% and in case of Montenegro by less than 1%). Countries with the highest population growth (around 60% to 40% respectively) were Egypt, Israel and Algeria; growth rates above the Mediterranean average (of 24.3%) were also recorded in Malta, Türkiye, Cyprus, Morocco, Libya, Syrian Arab Republic and Lebanon. Migration flows influence population numbers and move environmental pressures from one place to the other. In addition, human and natural disasters can cause spontaneous movement and displacement of large numbers of people. This may have significant impacts on the environment, such as deforestation and soil erosion, as well as depletion and pollution of water resources, impacting also the coastal and marine environment (UNHCR website 2023).
Human activities interact with the marine environment
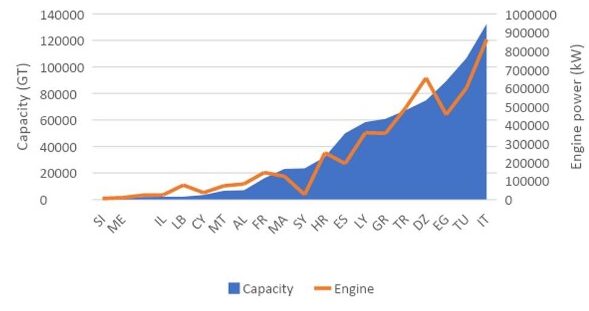
72. The relationship between maritime economic activities and the marine and coastal environment is characterised by impact and dependence. The maritime economy can foster the development of sustainable practices for livelihoods that depend on the sea and its resources. At the same time, if not properly managed, it can have environmental impacts that cause marine and coastal ecosystem degradation and hinder achievement of good environmental status (GES). In turn, degraded marine and coastal ecosystems provide fewer economic opportunities for those activities that depend on healthy ecosystems (fisheries, tourism, …). Other economic activities that heavily impact the marine environment can function independently from the state of the marine environment (maritime transport, offshore oil and gas, etc.).
73. In most Mediterranean countries, the regulation of maritime activities is still insufficient to make the maritime economy a sustainable blue economy, whether through legislation, monitoring or policing. This economic “openness” stands in contrast with the biological semi-closed character of the Mediterranean Sea (water renewal time of around 80 years). The fragmentation of policies, including within countries, and the persistence of insufficiently rigorous international standards, are hindering the implementation of regulation, monitoring and sanctioning measures, essential for the sustainable use of common resources.
74. A knowledge gap remains when it comes to measuring the sustainability of maritime economic activities and their individual contribution to the degradation of the environment. This chapter provides a qualitative analysis of this link, while further work on the monitoring and observation of the pressures caused by the maritime economy needs to be conducted, linking the Blue Economy with the Ecosystem Approach.
75. However, action to “close the tap” of impacts on the marine environment that stem from the maritime economy cannot wait for complete datasets on these impacts to be available. In application of the precautionary principle, a well-calibrated balance between the development of the maritime economy and increased protection and restoration of the Mediterranean environment is needed, through urgent and systemic regulatory action, in order to achieve a truly sustainable Blue Economy that is compatible with achieving GES in the Mediterranean.
Tourism
Figure 7: Pressures exerted by the tourism sector on the marine environment.
Source: UNEP/MAP and Plan Bleu 2020.
76. Exceptional natural resources (including 46,000 km of coastline), cultural heritage, diversity of the region, its gastronomy and climate, coupled with favourable geographic location and good connectivity with the main source markets have all contributed to the Mediterranean becoming the world’s leading tourism destination (UN World Tourism Organisation, UNWTO, 2015; UNEP/ MAP and Plan Bleu, 2020). Mediterranean destinations developed a rich and diverse set of tourism products, services and experiences, completing the traditional sun and sea attractions with health, sports, nature and culture as well as cruise and business tourism.
77. Data on tourism specifically related to the Mediterranean coastal region is generally not available and data contained in this chapter refers to national data (all marine façades included for countries with multiple marine façades).
Tourism in the Mediterranean: the key facts
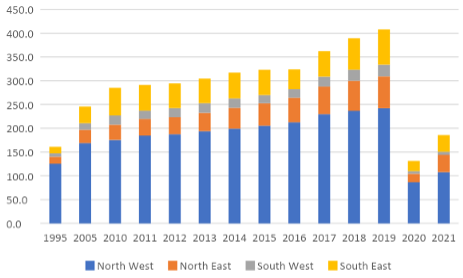
- Over the past 50 years (1970 – 2019), the number of international tourist arrivals (ITAs) increased by a factor of seven: from around 58 million in 1970 (161 in 1995, 246 in 2005) to 408 million in 2019
- During the past decade (2010 – 2019), a cumulative increase of ITAs to the Mediterranean countries was 43.2%
- In 2019, close to one third (27.8%) of the global ITAs were recorded in the Mediterranean
- Tourism was severely affected by COVID-19 pandemic: the number of ITAs decreased by more than two thirds in 2020; a moderate recovery was seen in 2021, with total number of ITAs reaching 45.5% of the 2019 level
- According to pre-COVID-19 projections, the total number of ITAs was to reach 500 million by 2030
- A strong growth in receipts from international tourism was recorded, with the total amount almost quadrupling between 1995 (USD 81 billion) and 2019 (USD 308 billion); the receipts plunged in 2020 (-64.3% compared to 2019 level)
- Economic impact of tourism is strong: contribution of tourism and travel to GDP has been estimated by WTTC at USD 943.4 billion, with 18.4 million direct and indirect jobs across the region in 2019; the COVID-19 crisis halved the GDP from tourism and travel in the Mediterranean, causing a loss of 3.1 million jobs
- Ranking within the top five Mediterranean destinations did not change much over time; Türkiye and Greece were the fastest growing; the cumulative share of the top five destinations in total Mediterranean ITAs has been gradually decreasing due to emergence and development of new destinations across the region
Table 4: Tourist arrivals in the Mediterranean
|
1995 (88% of the Med ITAs) |
2005 (82% of the Med ITAs) |
2019 (79% of the Med ITAs) |
| France (60.0 mill) | France (75.0 mill) | France (90.9 mill) |
| Spain (33.0 mill) | Spain (55.9 mill) | Spain (83.5 mill) |
| Italy (31.1 mill) | Italy (36.5 mill) | Italy (64.5 mill) |
| Greece (10.1 mill) | Türkiye (20.3 mill) | Türkiye (51.2 mill) |
| Türkiye (7.1 mill) | Greece (14.8 mill) | Greece (31.3 mill) |
Sources: Plan Bleu 2016; UNWTO 2022a; UNWTO 2022b; WTTC 2022.
Figure 8: International Tourist Arrivals (ITAs) in the Mediterranean (in millions).
Sources: Based on UNWTO 2022a; UNWTO 2022b.
78. The overall number of ITAs in Mediterranean countries reached 408 million in 2019. During the past decade (2010 – 2019) alone, an average annual increase of 13.7 million ITAs (4.1% year-on-year) was recorded. While tourism in the established North West Mediterranean destinations (primarily France, Spain and Italy) remained predominant, their relative share in the total numbers of visits decreased by nearly 20 percentage points between 1995 and 2019. The share of fast-growing destinations from the South East and North East (in particular Türkiye, but also Albania, Croatia and Montenegro) in the overall number of tourists in the region has increased considerably, in particular during the past 15 years. The share of ITAs to North East Mediterranean countries, for example, increased from 11.4% in 2005 to 16.4% in 2019. Despite significant potential, the contribution of South West destinations to the overall Mediterranean ITAs remained modest (5 to 6%). In 2019, the Mediterranean earned close to USD 308 billion in international tourism receipts8, which is approximately at the level of Egypt’s GDP for the same year, or 1.5 times higher than the GDP of Greece.
8
8 Spending by international visitors on goods and services in destinations.
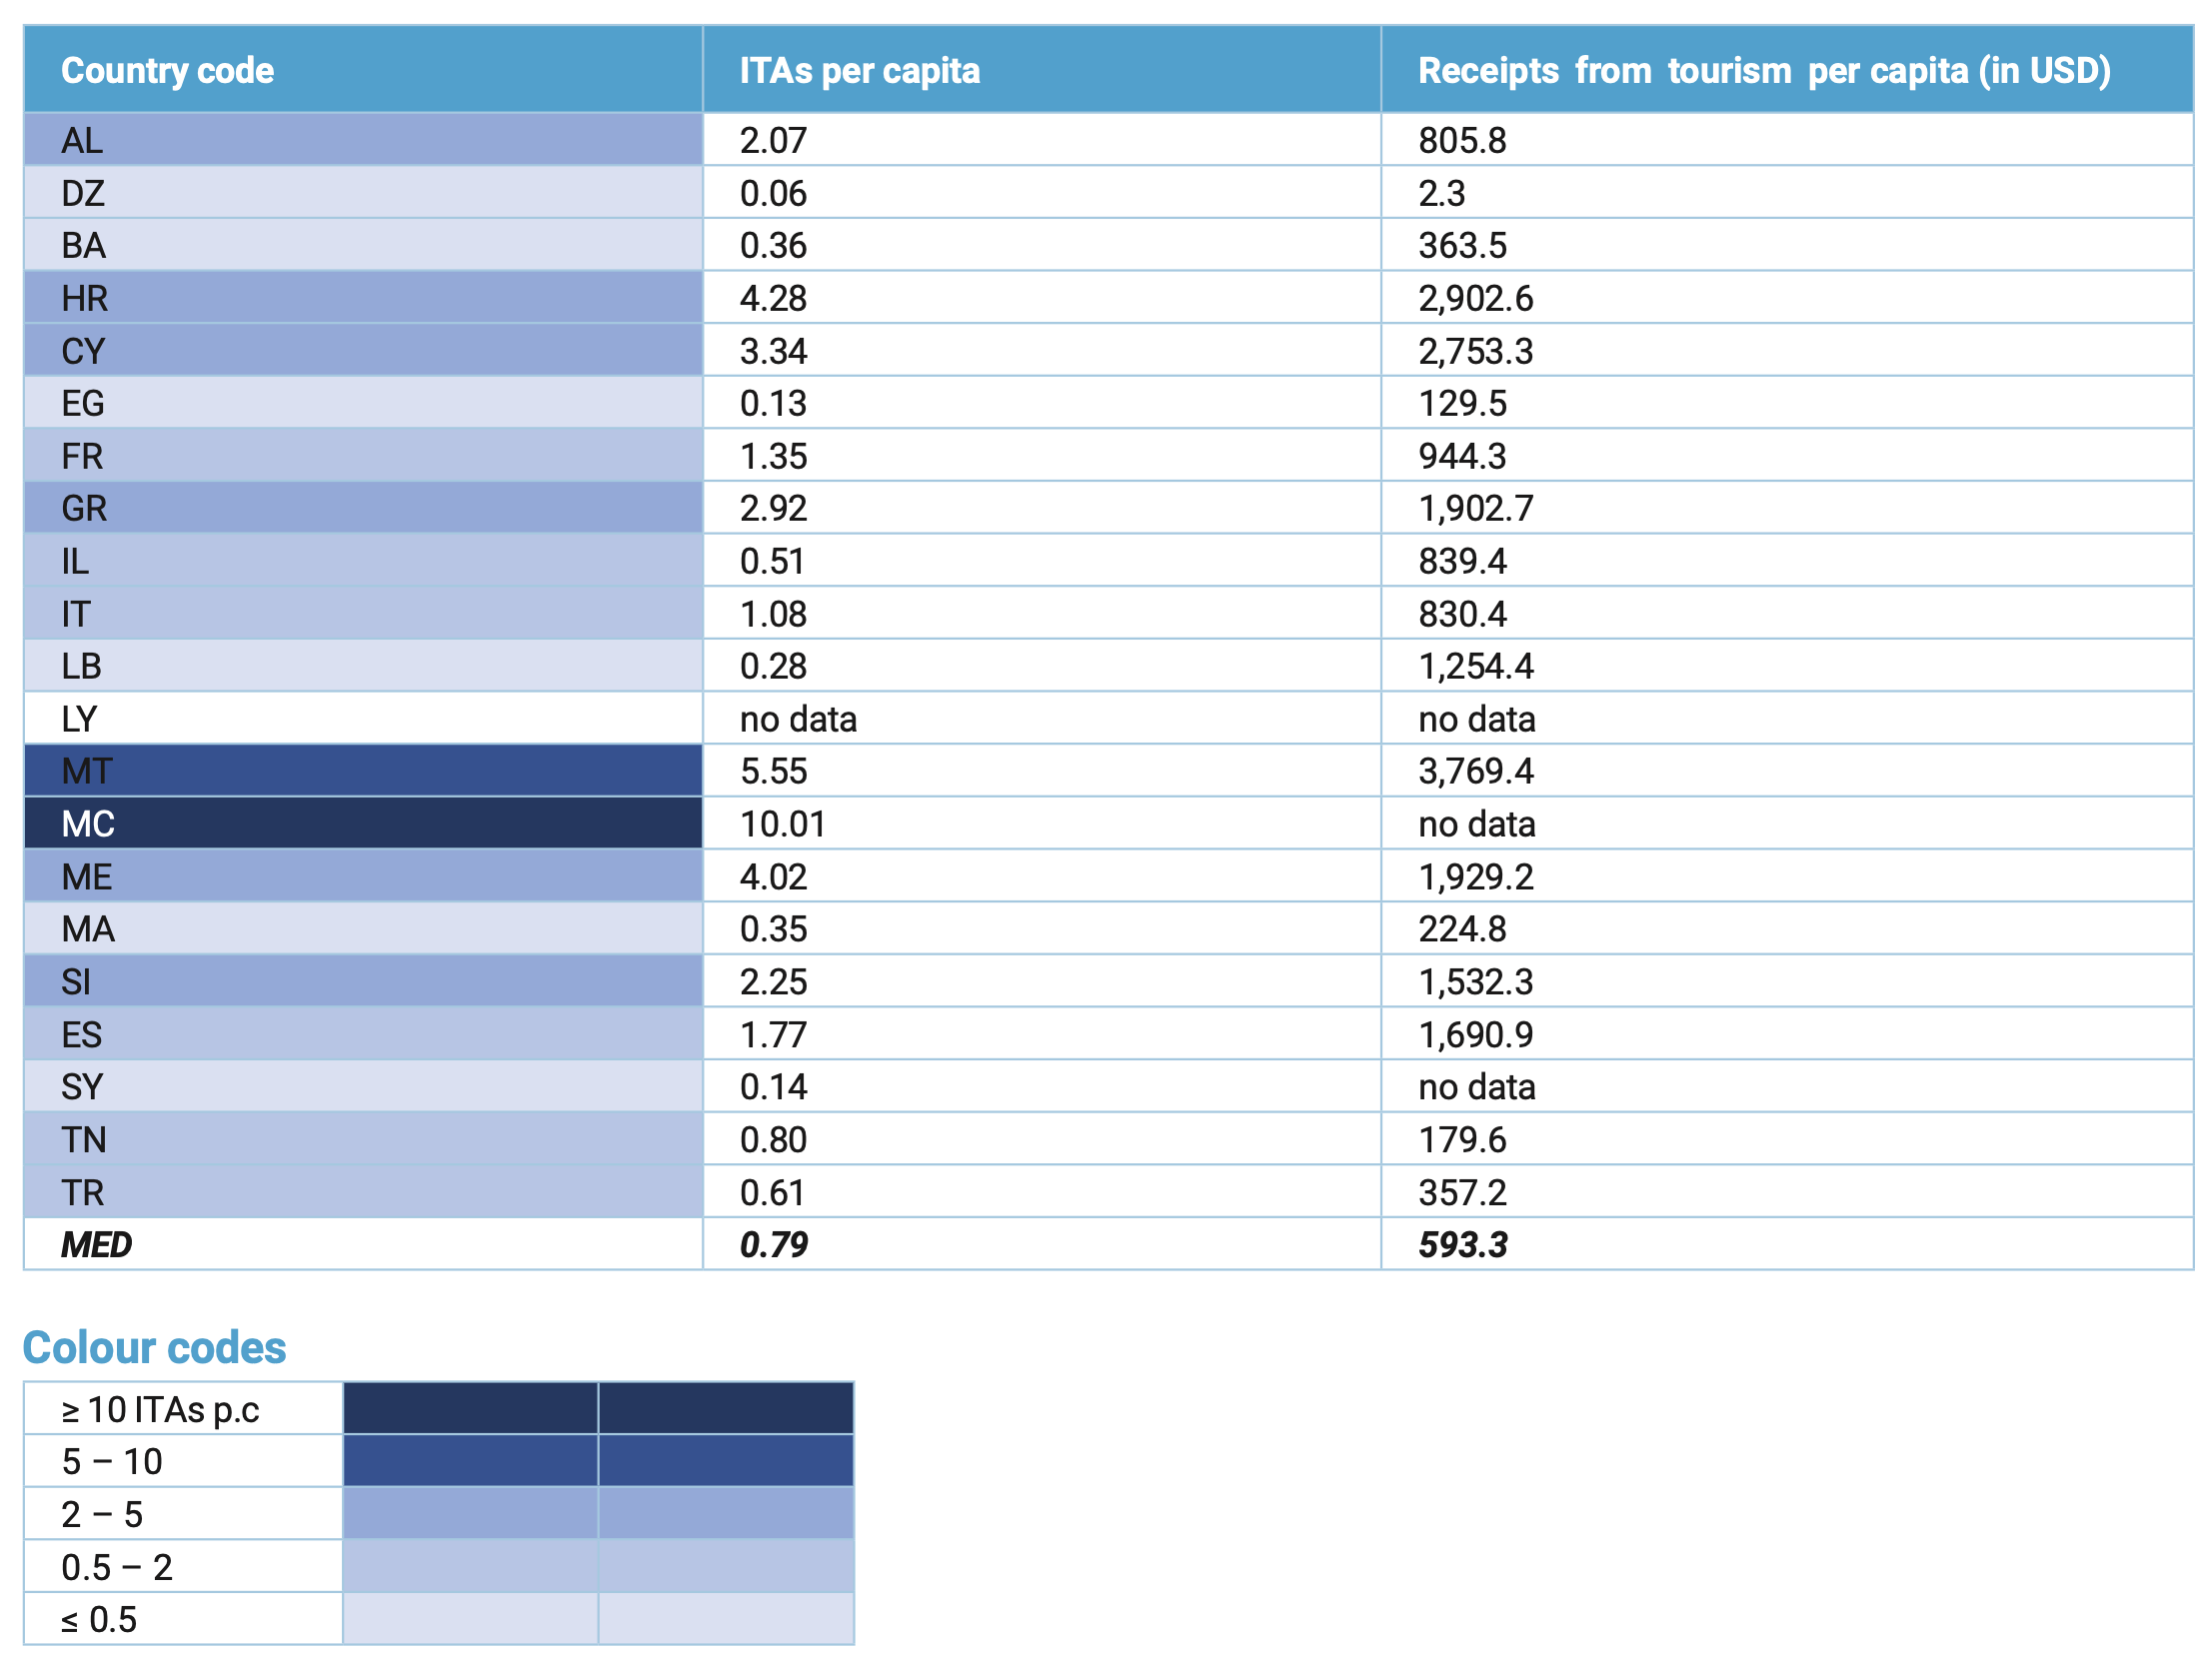
Table 5: International Tourist Arrivals (ITAs) and receipts from tourism per capita.
Sources: Based on UNWTO 2022a; UNWTO 2022b; World Bank 2022.
79. The main pressures of the tourism sector on the marine environment are marine litter, coastal land take, habitat degradation, air emissions, water consumption and sewage generation, and proximity to natural sensitive areas (UNEP/ MAP and Plan Bleu 2020). Fluctuations in numbers of tourist arrivals come with a direct impact on the environment due to resource consumption and generation of externalities that are caused at the individual level, and that add on to more general impacts caused by tourism infrastructure.
80. In recent years, the number of tourist arrivals in Mediterranean countries was highly variable due to several reasons: Armed conflicts in the region, security concerns as well as political instability along with deteriorating social and economic conditions, all resulted in tourism downturns and/ or serious disruptions in some of the SEMC in the period since 2010, affecting in particular Syrian Arab Republic (with 8.1 million ITAs in 2010 and only 2.4 million in 2019), Libya, Egypt and Tunisia9. Egypt experienced a rapid tourism growth in the past – from 2.9 million arrivals in 1995 to a record of 14 million in 2010. However, following the 2011 instability and related events, ITAs plummeted and remained below 10 million for several years, to start rising again in 2018 and 2019.
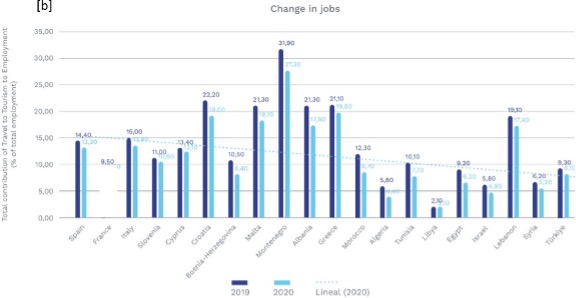
81. The COVID-19 pandemic brought the total number of international arrivals down to 131.4 million in 2020 (-67.8% compared to 2019) i.e., well below the 1995 level (of 161 million). Receipts also plummeted from USD 308 billion in 2019 to USD 110 billion in 2020 (- 64.3%), while losses were spread unevenly across the region: Monaco and France recorded the lowest decreases in ITAs (- 50% and -54% respectively), while Cyprus was the most affected (-85%), followed by Montenegro (- 84%), Bosnia and Herzegovina (-83.3%) and Israel (-82.6%). Signs of recovery were visible already in 2021, with the total number of ITAs reaching 45.5% of the 2019 level, representing an increase of 41.3% compared to 2020, whereas receipts increased by an even larger margin (56.7%). Mediterranean tourism recovered faster than the global average and regional ITAs made up as much as 41.6% of the world tourism in 2021, compared to 27.8% in the pre-pandemic 2019. According to the WTTC data10, the impact of COVID-19 crisis on employment was less severe than the impact on on tourism GDP: following a loss of 3.1 million jobs across the region in 2020 (a decline of 17.1% compared to 2019), total employment in 2021 was 16.8 million (representing a decline of 8.8% in relation to 2019). Full recovery of global tourism to pre-pandemic levels is projected for 2024 (EIU 2022).
82. According to available estimates, almost half (47.2%) of all ITAs to Mediterranean countries in 2017 were linked to coastal areas (UNEP/MAP and Plan Bleu 2020). Shares of coastal tourism varied markedly between different groups of countries, reaching for example 85% in the North East Mediterranean countries while remaining below 40% in North West and South East; the estimated share of coastal tourism in the South West Mediterranean was around 62%. In 2019, coastal areas accounted for a very high share of the total nights spent in tourist accommodation in Malta (100%), Cyprus (97%), Greece (96%), Spain (96%), and Croatia (93%) (EU 2022). Nights spent in coastal regions of EU countries in 2018 represented 42% of the total; at the same time, coastal regions had the highest tourism intensity11 with 12.3 nights-spent per inhabitant (Batista e Silva et al. 2020).
83. While tourism had a strong positive economic impact across the region and has emerged as a pillar of many national economies in the Mediterranean, the benefits associated with tourism came at significant environmental and social costs. The negative impacts of tourism have been widely recognised and documented12, and there is a growing set of recommendations, policies and projects aiming at the development of sustainable tourism in the Mediterranean. When ITAs decreased in recent years, pressures on the environment caused by tourism decreased as well, giving coastal and marine biodiversity “a break” and the possibility to recover in some places, in conjunction with decreasing pressures from other human activities. For example, some marine species occurrences increased and water quality improved in many places during the COVID-19 pandemic (Coll 2020). But the dominant Mediterranean mass tourism model has picked up speed again and continues to concentrate in coastal areas. Unless this model is profoundly changed into a sustainable model, the coastal and marine environment is likely to continue to be adversely affected by tourism in the years to come.
9, 10, 11, 12
9 During 1990’s, similar effects of conflicts and instability were seen in some Balkan countries that have recovered meanwhile and became major tourist destinations.
10 Refer to direct and indirect GDP/ jobs.
11 Compared to other types of tourism such as mountains and nature, cities, urban mix, and rural.
12 In e.g., Plan Bleu, 2016; UNEP/ MAP and Plan Bleu, 2020; Plan Bleu, 2022; Fosse et al., 2021.
Figure 9: Change in tourism GDP(a) and jobs (b), 2019-2020.
Note: For Morocco share of tourism in GDP 7,1% in 2019 Source: Moroccan Ministry of Tourism
Source: Plan Bleu (2022). State of Play of Tourism in the Mediterranean, Interreg Med Sustainable Tourism Community project.
Fisheries and Aquaculture
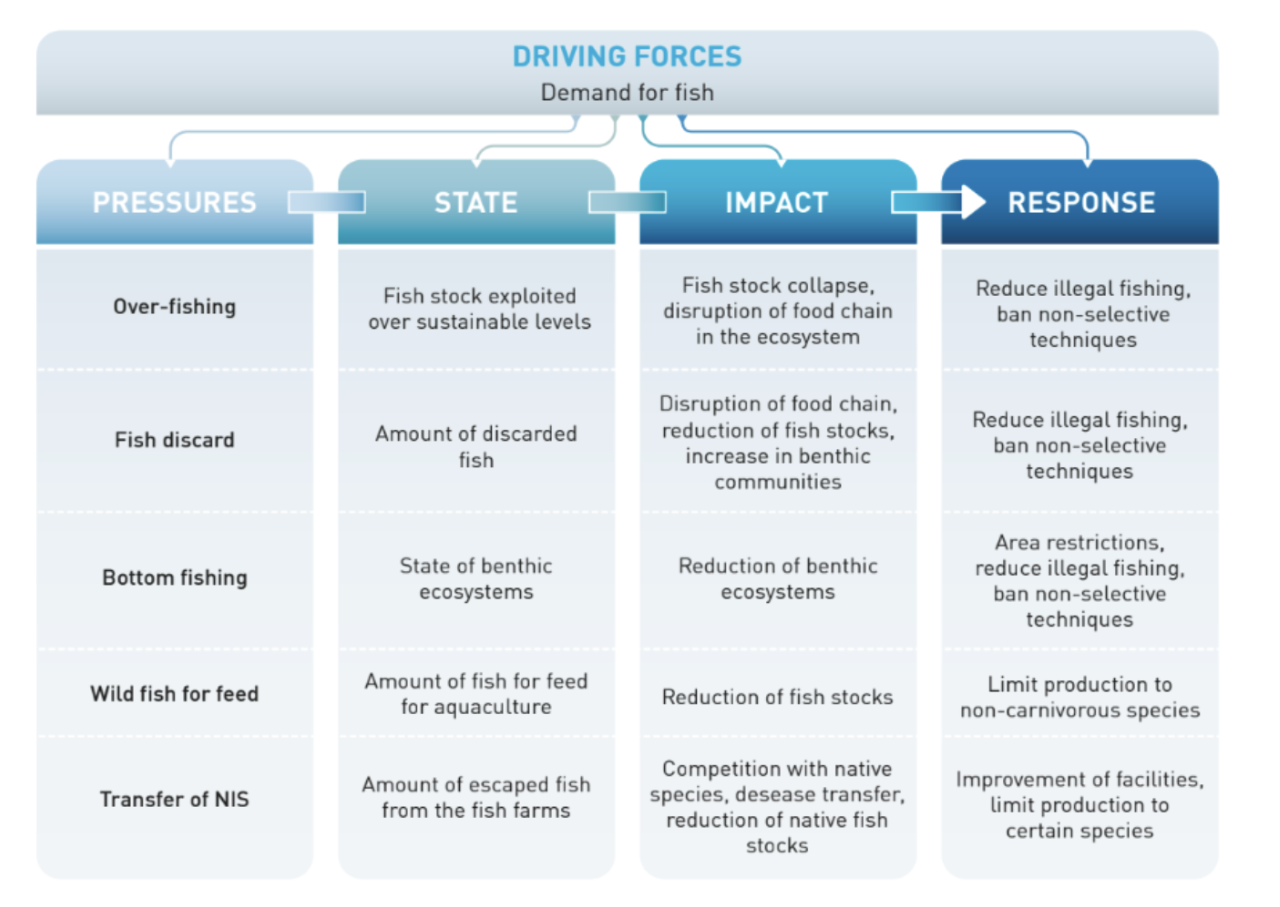
Figure 10: Pressures exerted by fisheries and aquaculture.
Source: UNEP/MAP and Plan Bleu 2020.
84. A variety of capture fishery and aquaculture techniques are employed across the Mediterranean at different scales, including industrial, semi-industrial and small-scale fisheries, as well as industrial and small-scale farming. Capture fisheries exploit a variety of benthic and pelagic fish stocks, molluscs and crustaceans. Aquaculture production includes extensive aquaculture in pond or lagoon areas and small family farms cultivating mussels, but also more intensive offshore finfish cage farms. Fishery and aquaculture represent a relatively small sector of the Mediterranean blue economy (both in terms of GVA – less than 5%, and job creation – less than 10%)13, nevertheless with an important socioeconomic and cultural function in terms of food production, revenue, employment and preservation of traditional activities (UNEP/MAP and Plan Bleu 2020).
13
13 Union for the Mediterranean (UfM) 2017 report Blue economy in the Mediterranean, https://ufmsecretariat.org/wp-content/uploads/2017/12/UfMS_Blue-Economy_Report.pdf based on earlier Plan Bleu analyses (e.g., 2014 report Economic and social analysis of the uses of the coastal and marine waters in the Mediterranean, https://planbleu.org/sites/default/files/publications/esa_ven_en.pdf).
Fisheries14
85. According to the latest available data (as reported to the GFCM Secretariat and/ or estimated), a total of 76,280 fishing vessels were operating by 2019 in 20 Mediterranean countries15, with a total capacity of around 758,000 gross tonnage (GT)16. These figures are likely to be underestimating the actual size of the fleet, given the lack of data in some countries, especially regarding small-scale vessels (FAO 2020).
Figure 11: Capacity of the fishing fleet operating in the Mediterranean basin by country, 2019.
Source: FAO 2020; own estimate.
86. In terms of capacity (expressed in gross tonnage (GT)), more than 62% of the fishing fleet is operated by five countries: Italy (17.5%), Tunisia (14.1%), Egypt (11.8%), Algeria (9.8%) and Türkiye (8.9%17). Greece’s fishing fleet makes 16.8% of the total number of vessels, but only 8% of the total capacity, indicating that small-scale fisheries are prevalent. Besides Greece, small-scale fishing vessels account for 90% or more of the total fleet in Lebanon, Cyprus, Türkiye, Tunisia, Croatia and Morocco18. Four out of five fishing vessels in the Mediterranean are small-scale vessels19 which are the predominant fleet segment in all Mediterranean fishing sub-regions, in particular in the Eastern and Central Mediterranean. Another important fleet segment are trawlers and beam trawlers, accounting for 7.9% of the total, predominantly used in the Western Mediterranean and the Adriatic; purse seiners and pelagic trawlers make up 5.5% of the fleet.
14, 15, 16, 17, 18, 19
14 For capture fisheries, information on fishing fleet, landings, revenues and jobs is predominately based on the report on the State of Mediterranean and Black Sea Fisheries (FAO, 2020).
15 Data for Türkiye refers to the number of vessels operating in the Mediterranean, whereas capacity of these vessels was estimated based on an assumption it mirrors the share (39.3%) of the total number of vessels reported for the Mediterranean and Black Seas. Bosnia and Herzegovina and Monaco informed the GFCM Secretariat they had no operating fishing fleet in the last reporting period.
16 The overall number of vessels reported and/ or estimated (by FAO, 2020) for the Mediterranean and the Black Sea was 87,641 (903,270 GT).
17 Taking only into account 6,026 vessels that operate in the Mediterranean. Türkiye’s total fishing fleet operating in the Mediterranean and Black Seas was reported to include 15,352 vessels (with capacity of 171,785 and engine power of 1,261,241 kW).
18 For Morocco: According to the Moroccan Department of marine fisheries, reference year 2021.
19 Including small-scale vessels 0–12 m with engines using passive gear; polyvalent vessels 6–12 m; and small-scale vessels 0–12 m without engines using passive gear. Polyvalent vessels are all vessels using more than one gear type, with a combination of passive and active types of gear, none of which are used for more than 50 percent of the time at sea during the year.
Table 6: Mediterranean fishing fleet by country and segment
|
Country code |
No of vessels |
Share (%) of operating vessels by fleet segment | ||||
|
Small- scale |
Trawlers, beam trawlers | Purse sein., pelagic trawl. |
Other segments20 |
Unallocated |
||
| AL | 445 | 67.0 | 27.0 | 5.2 | 0.9 | 0.0 |
| DZ | 5,608 | 61.8 | 9.9 | 28.4 | 0.0 | 0.0 |
| HR | 6,211 | 91.2 | 5.5 | 2.7 | 0.5 | 0.0 |
| CY | 774 | 94.4 | 1.0 | 0.0 | 4.5 | 0.0 |
| EG | 3,945 | 44.6 | 24.0 | 5.3 | 26.1 | 0.0 |
| FR | 1,418* | 88.9 | 6.0 | 1.1 | 3.9 | 0.0 |
| GR | 12,807 | 95.4 | 1.8 | 1.7 | 1.2 | 0.0 |
| IL | 336 | 79.8 | 5.7 | 3.0 | 11.6 | 0.0 |
| IT | 10,909 | 69.7 | 18.6 | 4.1 | 7.6 | 0.0 |
| LB | 2,084 | 95.0 | 0.0 | 4.4 | 0.7 | 0.0 |
| LY | 3,974 | 73.3 | 2.0 | 3.1 | 17.8 | 3.7 |
| MT | 682 | 77.6 | 2.9 | 0.6 | 18.9 | 0.0 |
| ME | 224 | 85.3 | 5.8 | 8.9 | 0.0 | 0.0 |
| MA | 3,496* | 87.0* | 4.3 | 7.0 | 1.7 | 0.0 |
| SI | 72 | 87.5 | 12.5 | 0.0 | 0.0 | 0.0 |
| ES | 2,056 | 51.2 | 28.0 | 10.7 | 10.1 | 0.0 |
| SY | 1,300 | 0.0 | 0.0 | 0.0 | 0.0 | 100.0 |
| TU | 13,300 | 92.7 | 3.6 | 3.4 | 0.3 | 0.0 |
| TR | 6,026 | 93.9 | 3.8 | 1.0 | 1.4 | 0.0 |
| Med total | 76,280 | 80.5 | 7.7 | 5.4 | 4.5 | 1.9 |
* For France: 1,340 in 2020 according to national French sources DGAMPA, SSP, Ifremer-SIH, 2020. For Morocco: 3,543 vessels on the Mediterranean façade in 2021, of which 92% artisanal according to the Moroccan Department of marine fishing. (Source: FAO 2020).
20 Includes polyvalent vessels 12–24 m, longliners 12–24 m, dredgers 12–24 m, and longliners > 6 m.
87. Contribution of the Mediterranean and Black Sea fisheries to the global marine capture ranged from 2.55% during the 1980s to 1.55% in 2020 (FAO 2022), taking into account that the Mediterranean Sea represents less than 1% of the world’s ocean surface. After an irregular decline in total landings in the Mediterranean that started in the mid-1990s and led to the lowest volumes in 2015 (760,000 tonnes), production increased again over the following three years to 805,700 tonnes in 2018. The average landings over the 2016-2018 period were 787,830 tonnes (a 3% increase compared to the average for the period 2014-2016).
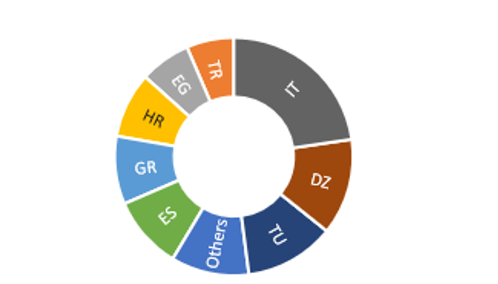
88. From 2016 to 2018, Italy continued to be the main producer (22.7% of the total Mediterranean landings), followed by Algeria (13.1%), Tunisia (12.2%), Spain (10%), Greece (9.3%), Croatia (8.9%), Egypt (6.9%), and Türkiye21(6.4%). The remaining 12 countries22 accounted for less than 4% individually; added together, their landings represented 10.6% of the Mediterranean total. Compared to the previous period (2014-2016), total landings increased the most in Türkiye (by 20.4%), while as the most substantial decrease (-10.6%) among major producers was recorded in Morocco; in Slovenia and Israel average landings decreased by 30.5% and 22.2% respectively.
Figure 12: Distribution of landings per country, average 2016-2018.
Source: FAO 2020.
89. In the period 2016-2018, the main species and their contributions to the total catch were as follows: sardine (23%); European anchovy (14.1%); Sardinellas nei (5.8%); marine fishes nei (4.6%); jack and horse mackerels nei (2.8%); deep-water rose shrimp (2.8%); bogue (2.6%); and European hake (2.5%); other species’ individual contributions were below 2%.
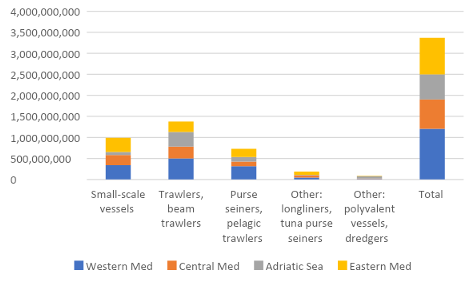
90. During the five years 2013-2018, total revenues in the GFCM area (including Black Sea) were between 3.2 and 3.6 billion (in constant 2018 USD). Total revenue/ value at first sale23 from marine capture fisheries in the Mediterranean is estimated at USD 3.4 billion in 2018. When different fleet segments are considered, the highest revenues are generated by trawlers, followed by small-scale vessels and purse seiners/ pelagic trawlers. As regards the fishing sub-regions, predominant shares of total revenues are generated in the Western and Eastern Mediterranean (FAO 2020).
21, 22, 23
21 Average landings 2016-2018 for the Mediterranean Sea equalled 50,772 tonnes; average total landings (including Black Sea) were 273,977.
22 Total landings by Bosnia and Herzegovina and Monaco are negligible.
23 Revenue is estimated as the value at first sale of fish from vessel-based marine capture, prior to any processing or value-addition activities.
Figure 13: Revenue by fleet segment and sub-region (constant 2018 USD).
Source: FAO 2020.
91. The wider economic impact of fisheries along the value chain in the region, including direct and indirect and induced effects, is estimated to be 2.6 times the value at first sale (FAO 2018). In the Mediterranean, revenue from small-scale fisheries makes 29% of the total; however, in some countries (e.g., Cyprus, France, Greece, Lebanon, Morocco, Slovenia), small-scale fisheries account for as much as 50% of the total revenue (FAO 2020).
92. According to FAO (2020), total employment onboard fishing vessels in the Mediterranean was near 202,000 in 2018. Approximately one third of these jobs are linked to fishing in the Western and Eastern Mediterranean sub-regions; the Central Mediterranean accounts for 24% of the total number of jobs, and the Adriatic Sea sub-region for 9%. Estimates from the previous analyses (for example by the World Bank, FAO and WorldFish) suggest that non‑vessel‑based jobs employ almost 2.5 times as many people as those onboard vessels. On average, employment onboard fishing vessels represents around 0.1% of total coastal populations (i.e., approximately one fisherman per 1,000 coastal residents), but is six to 11 times higher in Morocco, Croatia and Tunisia. Small-scale fisheries account for 55% of the total employment onboard fishing vessels (but the share can go to as much as 70 – 90% in some countries).
Women represent between 1 and 6% of the capture fisheries workforce. In processing, women either represent the majority of workers or are in the same numbers as men. Women are considered to play a vital role in the sale of fish, pesca-tourism and gastronomic activities. Where available, disaggregated data showed women were predominantly found in lower-level jobs with less pay than men (EC 2019).
93. The Mediterranean fisheries were severely affected by the COVID-19 pandemic (GFCM 2020; FAO 2020). A reduction in operating vessels of up to 80% was observed in some countries, with a decrease in production of some 75% during the first months following the outbreak. This may have led (at least temporarily) to reduced pressure on resources and the environment. Total marine captures in the Mediterranean and Black Sea decreased by 14.4% in 2020 compared to 2019, i.e., by 9.2% compared to the average annual production during the 2010s (FAO 2022) but longer-term COVID-19 impacts on fisheries are yet to be analysed.
94. Overall, fisheries in the Mediterranean remain highly threatened by overfishing, pollution, habitat degradation, invasive species and climate change (UNEP/MAP and Plan Bleu 2020). Among FAO’s 16 Major Fishing Areas in 2019, the Mediterranean and Black Sea had the second highest rate of stocks fished at unsustainable levels (63.4%), behind the Southeast Pacific with 66.7% (FAO 2022).
95. Most stocks remain in overexploitation; however, the number of stocks in overexploitation has further decreased, as has the overall exploitation for the whole Mediterranean and Black Sea region. For the stocks for which validated assessments are available, a notable decrease of stocks in overexploitation has been assessed in recent years: from 88% in 2014, to 75% in 2018. This dynamic is reflected in marked improvements for a number of demersal species in terms of fishing mortality and, in some cases, biomass, too (FAO 2020).
96. Nevertheless, the GFCM estimates the overall fishing mortality for all resources combined is nearly 2.5 times higher than sustainable reference points. A clear (although not significant) decreasing trend has been seen in the average exploitation ratio (current fishing mortality over target fishing mortality, F/FMSY) since 2012. Based on available information (for 62 stocks covering 20 geographical subareas and 14 species), 36% of Mediterranean stocks are assessed to have low biomass levels, 19% intermediate and less than a half (46%) high biomass level (FAO 2020).
97. In addition to its negative environmental impact, bycatch from fishing activities – including discards and incidental catch of vulnerable species – has significant implications for the sector, including from economic, regulatory and public perception perspectives. Sea turtles (around 89%) and elasmobranchs (around 8%) continue to represent the highest share of reported incidental catch of vulnerable species; seabirds and marine mammals together account for the remaining 3% (FAO 2020). Discards represent a window for improvement in the fishing sector as 18% of total catches are discarded (UNEP/MAP and Plan Bleu 2020, based on the FAO’s The State of Mediterranean and Black Sea Fisheries 2018).
98. While playing a particularly important cultural and employment role, small-scale fisheries are generally considered to have less ecological impact than industrial fisheries but can still have significant impacts that need to be addressed (Bolognini et al. 2019).
Aquaculture24
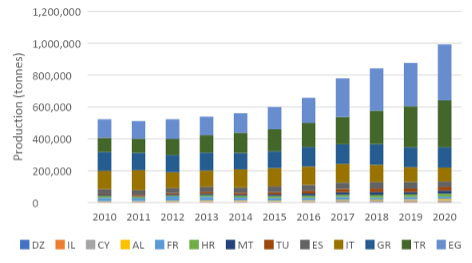
99. Total marine aquaculture production (excluding freshwater, including Türkiye’s Black Sea production) approached one million (994,623) tonnes in 2020 with average annual growth rates of 6.8% and a cumulative increase of around 90% between 2010 and 2020. The most extensive growth was recorded in Algeria, where production increased by a factor of 15 to 30. In the same period, production increased by several folds in Tunisia, Albania, Türkiye, Egypt and Malta. A decrease was recorded in France and Italy, as well as in Bosnia and Herzegovina and Lebanon. Marine aquaculture output was not negatively affected by the COVID-19 pandemic: production in 2020 increased by 13.2% compared to 2019.
100. The biggest aquaculture producers are Egypt, Türkiye, Greece and Italy. Taking into account the average annual production (2010-2020), Egypt and Türkiye accounted for 27.2 and 23.4% of the total respectively; due to high growth rates in these two countries, their relative shares in the overall production increased by 2020 approaching and/or slightly exceeding one third of the total (35.4% for Egypt and 29.5 for Türkiye). Egypt is a globally significant producer, where total aquaculture output (including freshwater) grew from less than half a million tonnes in the early 2000s, to 1.6 million tonnes in 2019, making more than 80% of the total fish production (capture fisheries and aquaculture) in the country (FAO 2022).
Figure 14: Aquaculture output 2010-2020: contribution of the main producers.
Note: countries with production of more than a thousand tonnes in recent years (Cumulatively accounting for more than 99% of the total) shown in the graph.
Source: FAO 2022a, FishStatJ database accessed November 2022.
101. In 2019, production of less than one thousand tonnes was recorded in Slovenia (914), Morocco (465), Montenegro (379), Bosnia and Herzegovina (176) and Lebanon (19).
102. Among the top five producers, stable output trends were recorded in Greece and Spain, while in Italy production dropped by a quarter in 2020 compared to 2010 (mainly due to reduced shellfish production). High growth rates characterise production in Türkiye and Egypt, especially as of 2016.
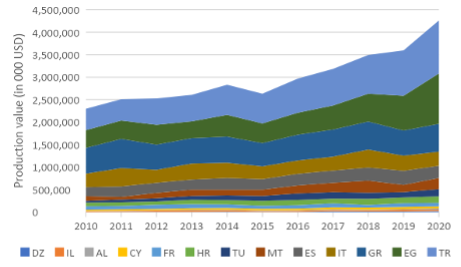
103. Value of production increased from USD 2.3 billion in 2010 to USD 4.3 billion in 2020. In 2018, aquaculture production value (USD 3.5 billion) slightly exceeded total revenue from capture fisheries (USD 3.4 billion)25. Highest production values in 2020 were recorded in Türkiye, Egypt, Greece, Italy, Spain and Malta (accounting for some 88% of the total).
24, 25
24 Information on production (quantity, value) 2010-2020 from the FAO FishStatJ database (FAO 2022a). Data for Libya and Syrian Arab Republic were not available for the observed period; no production reported for Monaco. Data for Türkiye include Black Sea aquaculture. Sources other than FishStatJ database were used, as referenced in the text. Although freshwater aquaculture may impact the marine environment via discharges to Sea, freshwater aquaculture has not been considered in this analysis.
25 It should be noted that aquaculture production value includes Türkiye’s Black Sea production (while capture fisheries revenue refers only to the Mediterranean fishing area).
Figure 15: Aquaculture production value, main producers 2010-2020.
Source: FAO 2022a, FishStatJ database accessed November 2022.
104. Mediterranean marine aquaculture is dominated by finfish, accounting for 83% of the total production; molluscs account for 16% of the overall output. Gilthead seabream (Sparus aurata) and Seabass (Dicentrarchus labrax) are the most commonly farmed species, at 464,000 tonnes and USD 2.24 billion in 2019. More than 95% of the world’s seabream and seabass production comes from aquaculture, of which 97% is produced by Mediterranean countries. In terms of quantity, other important farmed species are mullets and mussels. With a production of 99,200 tonnes in 2019, Mediterranean mussel (Mytilus galloprovincialis) is the fourth most farmed species in the region, with Italy (62% of the region’s production) and Greece (24%) as the main producers (Carvalho and Guillen 2021). Bluefin tuna are also raised in some locations.
105. Data on aquaculture jobs are less available than for capture fisheries. One of the recent estimates suggest that Mediterranean aquaculture offers employment to 313,000 persons, taking into account both direct and indirect jobs (Bolognini et al. 2019). Like fisheries, aquaculture is also a sub-sector dominated by male workers in the EU Member States, with women representing 7% to 26% of the workforce, but with more opportunities being provided for women (EC 2019). In this sub-sector, there is also an unreported number of “invisible” female workers, particularly in small-scale freshwater aquaculture and shellfish farming.
106. Aquaculture made around half the total fishery output in the Mediterranean in recent years, and is expected to continue growing, in line with global trends. Its environmental effects depend on the size of the farms, the production systems and management methods used, as well as on the marine habitats in which they are located; aquaculture may harm the marine environment, and at the same time depends on a good quality environment to be productive (Bolognini et al. 2019).
107. Growth in aquaculture production in the Mediterranean can be accompanied with high dependency on fish meal from sea catches, large nitrate and phosphorus effluents, as well as genetic modification of natural fish stocks (UNEP/ MAP and Plan Bleu 2020). Some of the priority issues related to sustainable aquaculture development in the Mediterranean (Massa et al. 2017) include integration of aquaculture into coastal zone management and sea use planning, improvements in site selection and licensing procedures, enhancement of aquaculture-environment interactions and implementation of environmental monitoring.
Maritime transport
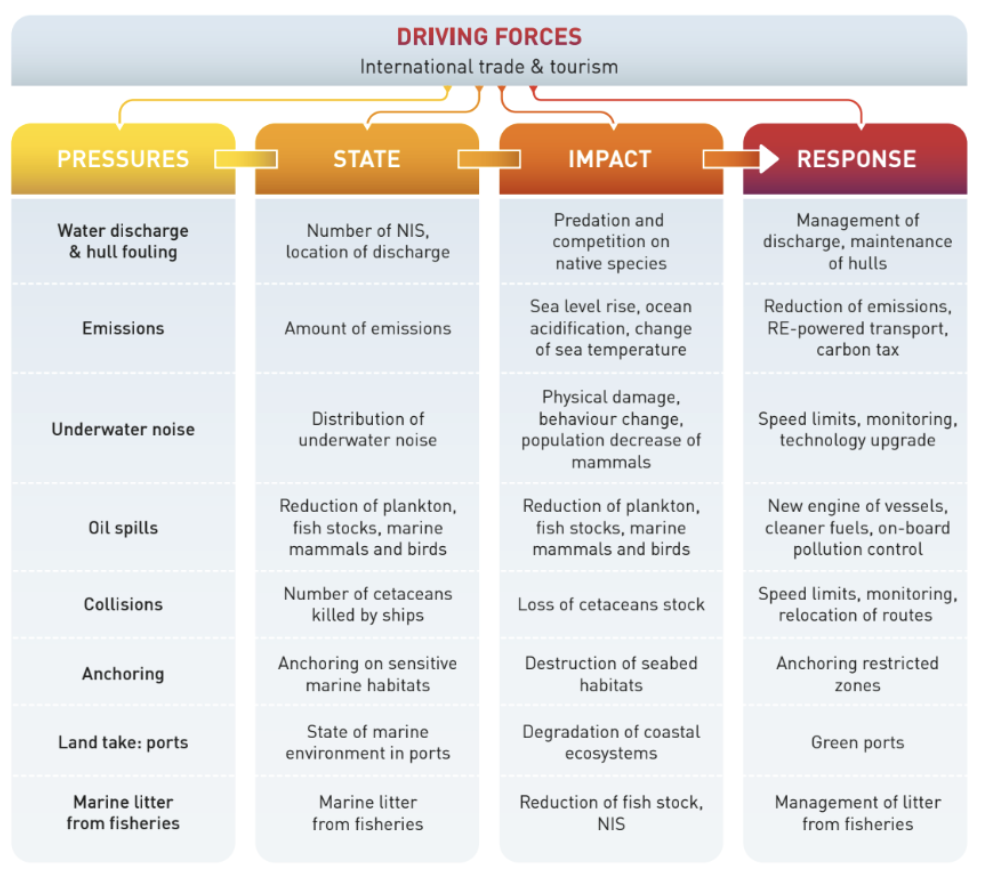
Figure 16: Pressures exerted by maritime transport on the marine environment.
Source: UNEP/MAP and Plan Bleu 2020.
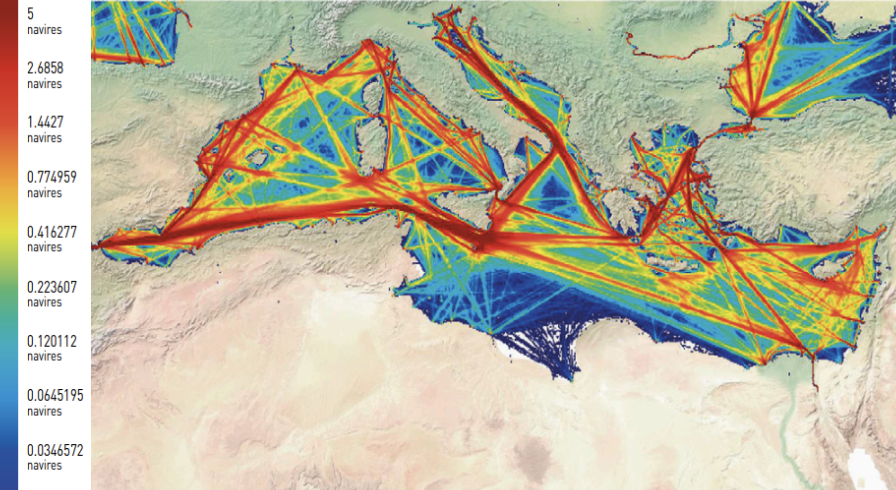
108. The Mediterranean Sea is located at the crossroads of three major maritime crossings: Strait of Gibraltar, opening into the Atlantic Ocean and the Americas; the Suez Canal, a major shipping gateway which connects to Southeast Asia via the Red Sea; and the Dardanelles Strait, leading to the Black Sea and Eastern Europe/Central Asia. With such a strategic location, it is an important transit and trans-shipment area for international shipping, as well as a realm for Mediterranean seaborne traffic (movement between a Mediterranean port and a port outside the Mediterranean) and short sea shipping activities between Mediterranean ports (UNEP/MAP and Plan Bleu 2020).
109. Despite covering less than 1% of the world’s oceans, the Mediterranean Sea accounted for more than a fifth (21-22%) of global shipping activity measured by the annual number of port calls, and around 9% of the annual container port throughput in recent years (Randone et al. 2019; own calculations based on UNCTAD 2022a). Approximately 18% of global seaborne crude oil shipments take place within or through the Mediterranean. In some countries (Croatia, Cyprus, Greece, Italy, Malta, Spain), maritime transport (including port activities and shipbuilding and repair) accounted for between 0.4 and 1.3% of the total employment in 2019. The Western Mediterranean and the Aegean- Levantine Sea are the busiest parts of the basin (Randone et al. 2019).
Figure 17: Traffic density in the Mediterranean Sea area.
Source: INERIS 2019.
110. Over the period 2015 – 2021, the merchant fleet registered in 20 Mediterranean countries26 encompassed a total of around 9,400 vessels, with a capacity of more than 245 million dead-weight tons in 2021. Total carrying capacity increased by 63.5% (from 152.9 million) in comparison with 2005. Four countries (Malta with 46.5%, Greece with 25.9%, Cyprus with 13.7% and Italy with 4.5%) account for 90% of the total merchant fleet carrying capacity (UNCTAD 2022a).
111. As regards ownership of the world fleet (by carrying capacity expressed in dead-weight tons) in 2021, five Mediterranean countries were among top 35 world economies: Greece (4,705 vessels in total, 620 under national flag) with 17.6% of the world total; Monaco (478 vessels, none under national flag), accounting for 2.1% of the total; Türkiye (1,548 vessels, 426 under national flag), 1.3%; Italy (651 vessels, 481 under national flag), 0.8%; and Cyprus (311 vessels, 134 under national flag), with 0.6% of the carrying capacity of the world’s fleet (UNCTAD 2021).
112. The Mediterranean has more than 600 commercial ports and terminals (Plan Bleu, 2014). Nine of these are among the 20 largest cargo ports in the European Union: Algeciras and Valencia (Spain), Marseille (France), Genova and Trieste (Italy), Piraeus (Greece), and Aliaga, Izmir and Ceyhan and İskenderun ports (Türkiye). Important ports in the southern Mediterranean with more than 1 million TEU include Port Said and Alexandria (Egypt), Tangier (Morocco), Beirut (Lebanon) and Haifa (Israel) (Grifoll et al. 2018; Randone et al. 2019).
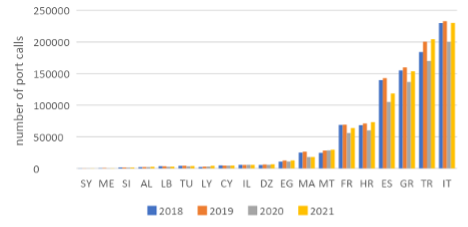
113. With nearly one million (935,649) port calls in 2021, volume of maritime transport reached 96% of 2019 level in the Mediterranean countries. Italy’s ports accounted for one quarter of the total port calls in 2021, Türkiye’s for one fifth, followed by Greece (16.4%), Spain (12.7%), Croatia (7.8%), France (6.8%) and Malta (3.2%). Share of passenger ships in total port calls in 2019 exceeded 75% in Croatia, Malta, Italy, Greece and Türkiye; cargo ship calls were predominant (accounting for 75% of the total or more) in Tunisia, Cyprus, Algeria, Slovenia and Israel. COVID-19 impact (measured by the number of port calls) was the lowest in Albania (-3% in 2020 compared to 2019), the highest in Montenegro (reduction of nearly 52%); in the countries with largest annual numbers of port calls, reduction was around 15% (UNCTAD 2022a).
26
26 No data for Bosnia and Herzegovina.
Figure 18: Number of port calls by country, 2018-2021.
Source: UNCTAD 2022a.
114. Shipbuilding activities are present in several Mediterranean countries (Egypt, Greece, Spain, Croatia, Türkiye, France and Italy), and represent a very small share of the global shipbuilding: with a share of 0.6 to 0.9% since 2016, Italy was the lead Mediterranean country. Türkiye is a provider for ship recycling, with 9.2% (or 1.6 million gross tons) of the total reported tonnage sold for ship recycling in 2020 (UNCTAD 2021).
115. The impact of the COVID-19 pandemic on international maritime trade was not as dramatic as initially expected27. Growth had already been weak in 2019 at 0.5%, and in 2020 total maritime trade declined by 3.8%. In 2021, a 3.2% growth was recorded bringing global maritime trade to only slightly below the pre-pandemic level. In line with the global expansion of seaborne trade, shipping in the Mediterranean basin is expected to increase in the coming years, in terms of both number of routes and traffic intensity.
116. The main pressures from maritime transport on the environment include: potential accidental and illicit discharges of oil and hazardous and noxious substances (HNS); marine litter; water discharge and hull fouling; air emissions from ships; underwater noise; collisions with marine mammals; land take through port infrastructure; and anchoring (UNEP/ MAP and Plan Bleu 2020).
27
27 A study (IEMed 2021) looking at the COVID-19 impacts in, inter alia the Western Mediterranean, found out that the number of vessels sharply decreased in the first days of mobility restrictions (starting from March 2020) compared to pre-disturbance baselines (i.e., equivalent periods of 2019), reaching an overall median drop of 51% during the initial national lockdowns (lasting approximately until 22 June 2020). Maximal reductions ranged from 22.2% (tankers) to 93.7% (recreational boats), with a maximal overall drop across all categories of 62.2% during mid-April.
Energy (Oil and Gas and Renewable energy – offshore)
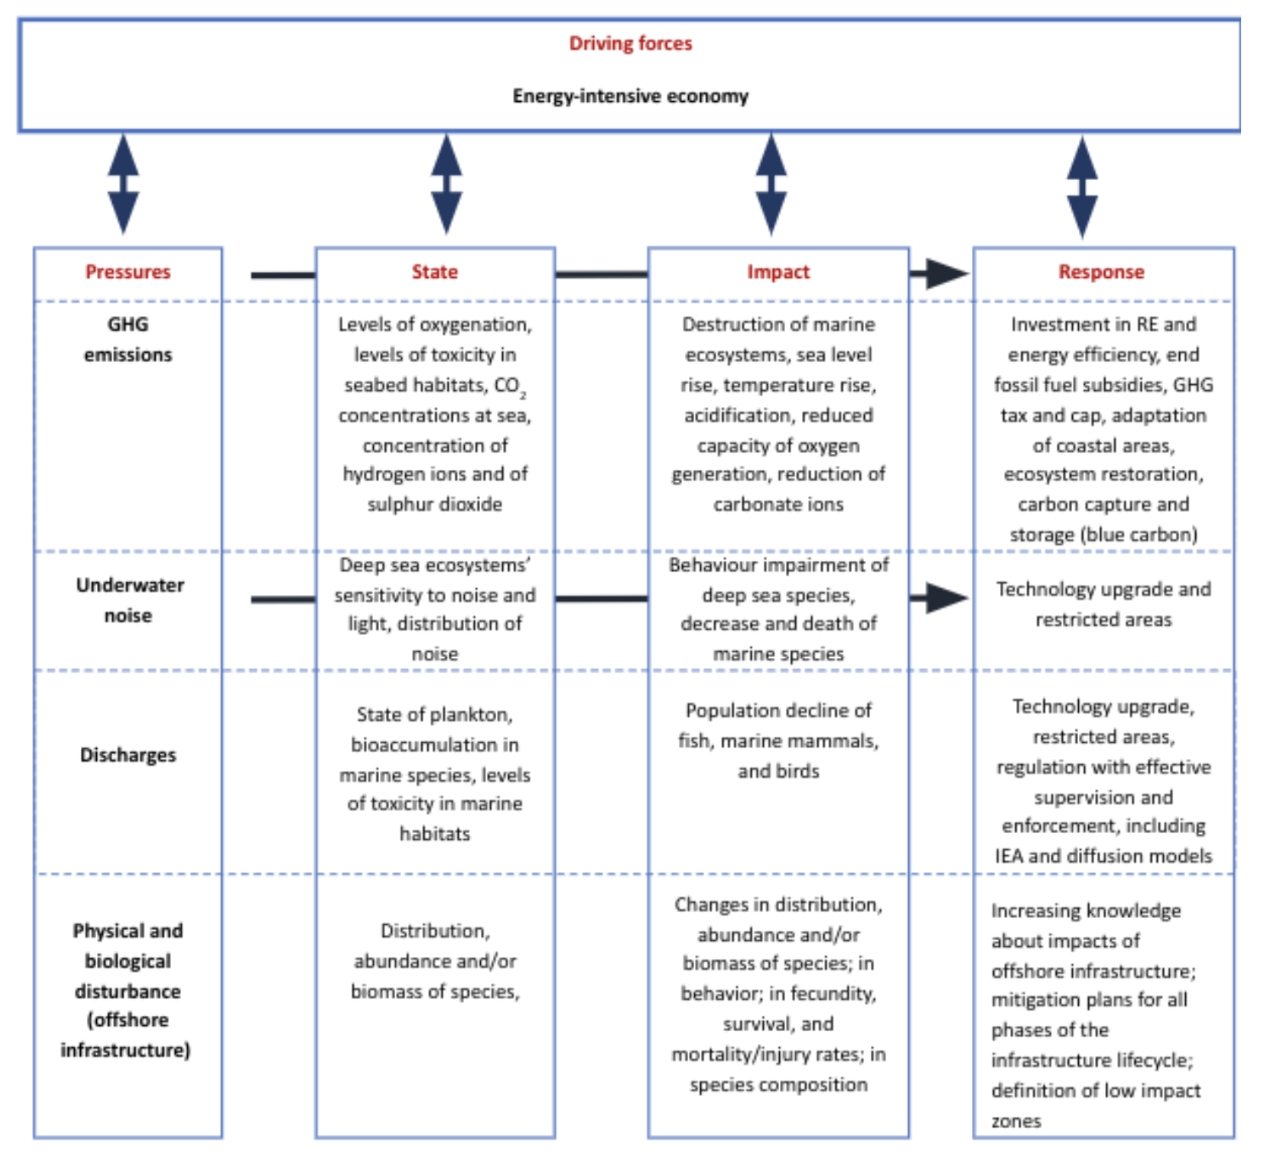
Figure 19: Pressures exerted by energy production and consumption in the Mediterranean.
Source: Based on UNEP/MAP and Plan Bleu 2020.
117. The Mediterranean region is a net importer of energy: in 2018, total consumption exceeded total production by 39%. If the current trends continue, import dependence is projected to grow over the next decades (OME 2021).
Primary energy demand:
118. Total primary energy demand (Table 7) in the Mediterranean equalled 1,021 Mtoe28 in 2018 and 1,030 Mtoe in 2019, with an overall increase of around 45% compared to 1990. In 2020, a decrease of around 9% was recorded due to the effects of the COVID-19 pandemic, bringing primary energy demand down to 938 Mtoe.
28
28 Million tons of oil equivalent.
Table 7: Primary energy demand in the Mediterranean
| 1990 | 2018 | 2020 | ||||
| Mtoe | Share (%) | Mtoe | Share (%) | Mtoe | Share (%) | |
| Coal | 106 | 14.9 | 105 | 10.3 | 95 | 10.1 |
| Oil | 350 | 49.1 | 369 | 36.1 | 322 | 34.3 |
| Gas | 108 | 15.2 | 303 | 29.7 | 284 | 30.3 |
| Nuclear | 97 | 13.6 | 124 | 12.1 | 99 | 10.6 |
| Hydro | 16 | 2.3 | 24 | 2.4 | 24 | 2.6 |
| Renewables | 35.5 | 4.9 | 96.1 | 9.4 | 113.6 | 12.1 |
| TOTAL | 712.5 | 1021.1 | 937.6 | |||
Source: OME (2021), Mediterranean Energy Perspectives to 2050, edition 2021.
119. Shares of coal and oil in the total primary energy demand had a downward trend over the past three decades, with a particularly pronounced decrease for oil (accounting for about half the energy demand in 1990, going down to around one third in 2020); shares of nuclear sources and hydro energy were relatively stable (Table 7). Major changes in the primary energy mix were seen for gas (doubling of the share in 2020 compared to 1990) and renewables (increase of 2.4 times between 1990 and 2020). Demand for renewables proved resilient to the effects of COVID-19 crisis, with a recorded increase of around 18% in 2020 (compared to 2018).
120. There are marked differences in the primary energy consumption across the Mediterranean, with the South Mediterranean countries currently accounting for 40% of the region’s total, while per capita energy demand in the South is less than half that in the North. Disparities are also pronounced as regards energy transition. Despite recent investments, some eastern and southern rim countries lag behind the Northern Mediterranean in energy mix diversification, energy efficiency improvements and in increasing the share of renewable energies (MedECC 2020).
Renewables
121. The most significant uptake of renewables has been recorded in power generation, while the share of renewable sources is still very low in end-use sectors, especially in industry and transport. In 2020, renewable energy technologies made up 43% (686 GW) of the total power generation capacity, deployed predominantly in the North Mediterranean countries. Nevertheless, the development of renewable capacity was very fast in the South and East where it nearly tripled over the period 2005 – 2020 (OME 2021).
122. Biomass and waste had a dominant share (59.3%) in the structure of renewables in 2020, followed by geothermal (14.6%), wind (14.4%) and solar (11.5%); the share of tide, wave and ocean energy was below 1%. Photovoltaics were the main contributor to solar energy demand in 2020, accounting for 58.6% of the total, followed by solar heating and cooling (25%) and concentrated solar power (16.3%). The fastest growing renewables are wind and solar: demand for wind energy reached 16.36 Mtoe in 2020 while it was non-existent in 1990; demand for solar energy increased from 0.54 Mtoe in 1990 to 13.11 Mtoe in 2020 (OME 2021).
123. Offshore wind installations, as well as wave, tide-current and thermal gradient energies are in the early stages of development in the Mediterranean. The offshore wind sector is expected to grow in the coming decades, inter alia due to new developments in floating platform constructions making them more suitable to deep waters. In the EU Mediterranean countries, production of electricity by offshore wind farms could reach 12 gigawatts (GW) in 2030 (UNEP/MAP and Plan Bleu 2020).
124. While supporting energy decarbonization, the expansion of marine energy production may lead to significant environmental impacts, many of which are not yet sufficiently studied: adverse impacts on bird behaviour, abundance and survival, especially if offshore wind farms are located on major migratory routes; impacts on behaviour and abundance of marine mammals including through noise; increased marine traffic to service the infrastructure; impacts on ecosystem structure, functions and processes; but also including potential positive impacts on biodiversity through the artificial reef effect of marine infrastructure. While knowledge gaps persist, marine renewables may hinder the achievement of good environmental status for biodiversity or seafloor integrity (Galparsoro et al. 2022).
Fossil fuels
125. Although shares of fossil fuels in the total primary energy are slowly declining, demand for oil and gas continued to rise in absolute numbers and the reliance on these energy sources is still very high across the Mediterranean. Coal, oil, and gas accounted for three quarters of the region’s primary energy demand in 2020.
126. The Mediterranean oil and gas resources (onshore and offshore) are assessed at close to 7% of oil and over 9% of the world’s conventional gas resources (OME 2021).
127. More than two hundred offshore oil and gas platforms were active in the Mediterranean in the second half of 2010s (UNEP/MAP and Plan Bleu 2020). With recent explorations (in the Levantine Basin, as well as in the Nile Delta Basin and the Aegean Basin) and new discoveries of large fossil fuel (mainly gas) reserves29, the number is expected to increase, with potential transformative effects for ecosystems and economies, in particular in the Eastern Mediterranean. In recent years, resurgence of interest in exploration has also been recorded in the Adriatic, in the areas south-west and west of Crete, and in the Ionian Sea (OME 2021).
128. Between 1990 and 2018, total production of fossil fuels in the Mediterranean increased by 8.3% (from 349 to 378 Mtoe), whereas oil and coal production shrank and gas production more than doubled.
129. Alternative gases were not used to a significant extent in the past. But the development and use of gases such as biomethane from organic sources, bio-LNG and synthetic natural gas, or by blending hydrogen30 into existing natural gas networks (OME 2021). Alternative fuels must be carefully produced and managed to avoid serious unintended consequences of their use, including greenhouse gas emissions.
130. When it comes to offshore oil and gas activities, environmental impacts may arise at all phases: exploration, exploitation and decommissioning. These impacts include oil discharges from routine operations, use and discharge of chemicals, atmospheric emissions, noise, light and physical impacts from the placement of pipelines and installations. During the transportation of oil and gas by pipeline or tanker, accidental spills from installations have the potential to cause impacts beyond the area of production. A high dependence of the Mediterranean region on fossil fuels is correlated to environmental risk stemming from the exploration, exploitation, decommissioning and transport of these fossil fuels (UNEP/MAP and Plan Bleu 2020).
29, 30
29 According to OME, 2021, one of the most important recent (2015) natural gas discoveries was the super-giant Zohr field offshore Egypt with 850 bcm of gas in place, confirming the substantial hydrocarbons potential in the Mediterranean Sea and the region’s significance in the global fossil fuels exploration and production industry.
30 Green hydrogen produced from water using renewable electricity or blue hydrogen produced from natural gas supported with Carbon Capture, Utilisation and Storage (CCUS).
Marine mining
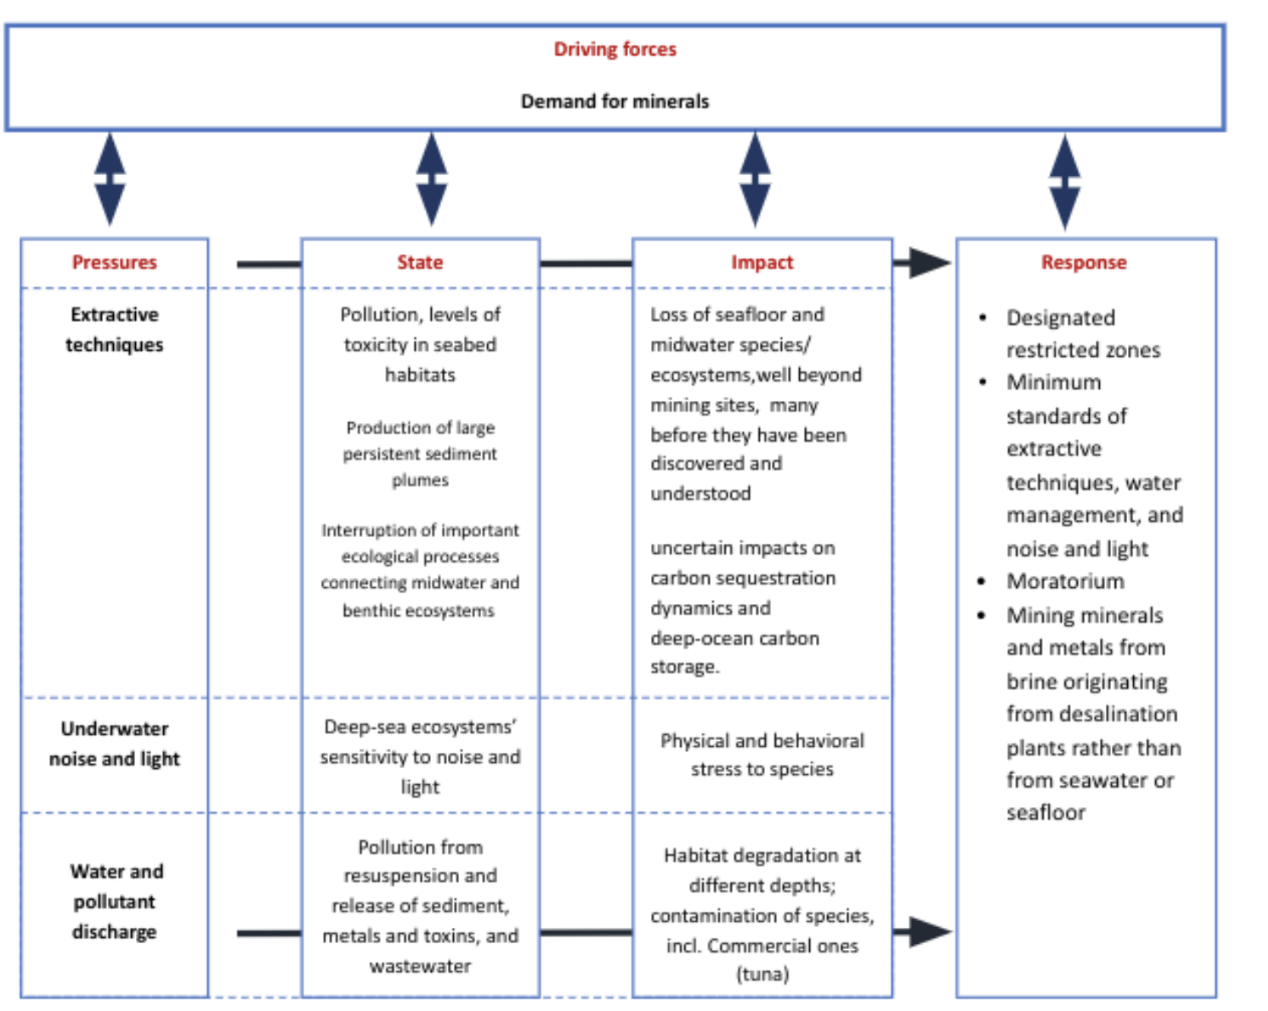
Figure 20: Driving forces (demand for minerals) in the Mediterranean.Source: Based on UNEP/MAP and Plan Bleu 2020 and Seabed mining science statement website31.
31 http://www.seabedminingsciencestatement.org, 2023
131. Marine and seabed mining is defined by OECD as the production, extraction and processing of non-living resources in seabed or sweater (OECD 2016). For example, this includes extraction of minerals and metals from the seabed (in shallow waters or the deep sea), marine aggregates (limestone, sand and gravel) and minerals dissolved in seawater. Analyses conducted in the framework of the European Maritime Spatial Planning Platform (Pascual and Jones 2018) offered the following definitions/ assessments:
- Marine mining refers to exploration, exploitation and extraction of marine minerals, such as iron ore, tin, copper, manganese and cobalt; the sector is characterised as growing;
- Deep-sea mining is done at depths from 800 to 6,000 m, primarily targeting deposits of polymetallic nodules, manganese crust and sulphides, and is in early stages of development – referred to as an emerging sector;
- The exploitation of marine aggregates is a mature sector that refers to exploration, exploitation, extraction and dredging of sand and gravel from the seabed, primarily for the purpose of construction and beach nourishment. Mining of aggregates had an estimated gross value added (GVA) of EUR 625 million and provided 4,800 jobs in Europe (EEA 2015).
132. At a longer time scale, Rare Earth Elements (REE) that are present in deep-sea mud may also become strategic mining targets as land-based reserves become progressively less accessible (Piante and Ody 2015) and demand for these resources is soaring especially with the massive electrification of the world economy. Seabed mining is thus likely to become a priority area of the maritime economy for further study, especially of the largely unknown but potentially significantly adverse environmental impacts.
133. Potential areas for seabed mining have been identified in the Mediterranean Sea, with sulphide deposits identified along the Italian and Greek coastlines (Piante and Ody 2015). Results of the EC funded project GeoERA-MINDeSEA32 revealed promising prospects in placer deposits near the coasts in the eastern Mediterranean – Greece and Cyprus, as well as ferromanganese crusts in the Western Mediterranean off the coasts of Spain and Morocco (Sakellariadou et al. 2022).
134. While the economic potential of deep-sea mining is assessed as significant, the Mediterranean is not considered a priority area for these activities. The UfM Blue Economy report concluded there were no projects that have been granted a mining license33 in the Mediterranean and no deep-sea activities by 2017, with the exception of the 2007 exploration project in the Tyrrhenian Sea in Italy. The slow development of deep-sea exploitation in the Mediterranean can be partially attributed to low technological development in the region and the lack of a dedicated regulatory system (UfM 2017). However, exploitation of the Mediterranean seabed may become more economically interesting with increasing global prices for relevant resources.
135. Potential environmental issues linked to deep-sea mining are not well known, which questions the sustainability of such a practice; the main pressures (with potential to cause harmful environmental consequences) are linked to extractive techniques, underwater noise and light, and water and/or chemical discharges (UNEP/MAP and Plan Bleu 2020).
136. An attempt to identify and understand better potential environmental impacts from deep-sea mining undertaken within the MIDAS project (Managing Impacts of Deep-seA reSource exploitation project, partly funded by the EU, implemented over the period 2013 – 2016) resulted in a set of recommendations and best practices for ensuring relative sustainability of the industry, including creation of conservation zones where mining activities would be prohibited; these recommendations were taken into account for the regulations of the EU Member States for areas located in their Exclusive Economic Zones, as well as for the regulations of the International Seabed Authority for international waters (located more than 200 miles from a State’s baseline) (UfM 2017).
32, 33
32 Launched in 2018 to map and to establish the metallogenic context for different seabed mineral deposits with economic potential in the pan-European setting.
33 Any project or activity being planned in a country’s continental shelf can not be conducted without explicit consent of that country and references in this report do not mean that consent has been obtained.
137. In the EU Communication on Blue Economy (EC 2021) it is emphasised that marine minerals in the international seabed area cannot be exploited before the effects of deep-sea mining on the marine environment, biodiversity and human activities have been sufficiently researched, the risks understood and before it is demonstrated that the technologies and operational practices do not cause serious harm to the environment (EC 2021).
The recent “Marine Expert Statement Calling for a Pause to Deep-Sea Mining” has been signed by 704 marine science & policy experts from over 44 countries. The scientists “strongly recommend that the transition to the exploitation of mineral resources be paused until sufficient and robust scientific information has been obtained to make informed decisions as to whether deep-sea mining can be authorized without significant damage to the marine environment and, if so, under what conditions”34.
34 https://www.seabedminingsciencestatement.org/.
138. Some statistics about marine mining are available for European countries: Overall, the share of the marine Non-living resources sector in the EU blue economy in 2019 was 0.2 % of jobs and 2.5 % of GVA (EU 2022). The Other minerals sub-sector continues to be on the rise, with a GVA of about EUR 160 million of GVA (3 % of the GVA in the sector of Non-living resources) and employment of 1,426 in 2019, referring mainly to marine aggregates rather than to mining activities. More than 50 million m3 of marine aggregates, primarily sand and gravel, are extracted from the European marine seabed, mostly for the construction industry, beach nourishment and sea defence construction (EU 2022). The demand is expected to continue rising as the construction sector expands and coastal communities try to adapt to new pressures posed by climate change.
139. Extraction of marine aggregate material, together with dredging, is recognised as highly damaging to seabed habitats. These activities result in substantive (and often permanent) alterations to hydrodynamic and ecosystem processes. The main pressures linked to extraction/ dredging include seabed disturbance and disruption of habitat, disruption to wildlife, pollution and water contamination, and use conflicts (UNEP Finance Initiative 2022).
Water abstraction
Freshwater resources
140. The Mediterranean region has been estimated to hold about 1.2% of the world’s renewable water resources and is recognised as one of the most water-challenged regions in the world (IAI 2021). The pre-existing water scarcity is being aggravated by population growth, urbanization, growing food and energy demands, pollution, and climate change (UNEP/MAP and Plan Bleu 2020).
141. The ten largest Mediterranean river basins are the Nile (Egypt), Rhone (France), Ebro (Spain), Po (Italia), Moulouya (Morocco), Meric/Evros (Greece, Türkiye), Chelif (Algeria), Büyük Menderes (Türkiye), Axios/Vardar (Greece) and Orontes/Asi (Türkiye). In the last 50 years, a decline in water discharge from rivers (estimated at around 340 km3) has been observed, resulting from multiple stressors such as decreasing precipitation, an increasing number of reservoirs and increasing irrigated areas (UNEP/ MAP and Plan Bleu 2020).
142. Total renewable freshwater resources of the countries belonging to the Mediterranean Basin were reported35 at between 1,212 km³ yr-1 and 1,452 km³ yr-1, with Northern Mediterranean countries holding between 72 and 74% of the resources and the SEMCs sharing the remaining 26 to 28% (MedECC 2020).
143. Analyses conducted towards preparation of the Fifth Assessment Report of the IPCC showed that by 2014, 44 out of 73 catchments36 in the Mediterranean region were under high to severe water stress, with hotspots in southern Spain, Tunisia, Libya, Syrian Arab Republic, Lebanon, and Israel. Furthermore, it was assessed that except for France and the Balkans, all the catchments in the Mediterranean would be under high to severe water stress by 2050, mainly due to climate change (reduced mean precipitation and groundwater availability, increased frequency and duration of droughts etc.), leaving 34 million people under high water stress and 202 million under severe water stress (IAI 2021). Water shortages, especially pronounced during the summer, coincide with tourism peaks in coastal areas.
35, 36
35 In the MedECC’s First Mediterranean Assessment Report, based on the data of the FAO’s Aquastat database and previous research.
36 Areas where water is collected by the natural landscape.
Water withdrawals
144. Total freshwater withdrawals in the Mediterranean countries were at the level of 290 billion m3 in 2019 (FAO Aquastat). The largest consumers were Türkiye and Egypt with 61.5 and 77.5 billion m3 respectively; freshwater withdrawals of around 10 billion m3 or higher were recorded in Algeria, Greece, Morocco, Syrian Arab Republic, France, Spain and Italy. Per capita withdrawals ranged from less than a 150 m3 to close to 1,000 m3 (Table 8).
Table 8: Freshwater withdrawals per capita and by sector, 2019
|
Total freshwater withdrawal (109 m3/ year) |
Total withdrawal per capita (m3 pc/ year) |
Withdrawals by sector (%) | |||
| Agricultu re | Municipa l | Industrial | |||
| AL | 1.13 | 392.58 | 61.2 | 21.0 | 17.8 |
| DZ | 9.802 | 243 | 63.8 | 34.4 | 1.8 |
| BA | 0.3055 | ||||
| HR | 0.67 | 176.74 | 11.0 | 62.6 | 26.4 |
| CY | 0.202 | 231.11 | 59.9 | 40.1 | 0.0 |
| EG | 77.5 | 772 | 79.2 | 13.9 | 7.0 |
| FR | 26.85 | 412.24 | 11.1 | 19.8 | 69.1 |
| GR | 10.115 | 965.77 | 80.2 | 16.7 | 3.2 |
| IL | 1.16 | 272.09 | 51.4 | 43.1 | 5.5 |
| IT | 34.05 | 564.62 | 49.7 | 27.8 | 22.5 |
| LB | 1.812 | 268.39 | 38.0 | 13.0 | 48.9 |
| LY | 5.72 | 860.21 | 83.2 | 12.0 | 4.8 |
| MT | 0.041 | 143.06 | 36.5 | 61.9 | 1.6 |
| MC | 0.005 | 128.32 | 0.0 | 100.0 | 0.0 |
| ME | 0.16 | 256.22 | 1.1 | 59.9 | 39.0 |
| MA | 10.573 | 286 | 87.8 | 10.2 | 2.0 |
| SI | 0.944 | 454.11 | 0.3 | 18.0 | 81.7 |
| ES | 29.469 | 630.53 | 65.3 | 15.3 | 19.4 |
| SY | 13.964 | 981.86 | 87.5 | 8.8 | 3.7 |
| TN | 3.781 | 328.76 | 76.3 | 22.5 | 1.2 |
| TR | 61.534 | 742.18 | 87.7 | 10.6 | 1.7 |
Source: FAO, 2023. AQUASTAT Core Database. Food and Agriculture Organization of the United Nations. Database accessed on 21 February 2023
145. Irrigated agriculture is the most water-demanding sector accounting for nearly 80% or more of total withdrawals in Egypt, Greece, Libya, Morocco, Syrian Arab Republic, Tunisia and Türkiye.
146. Besides freshwater withdrawals, a total of 6.6 billion m3 of treated wastewater is used across the region, primarily in Egypt, Spain, Israel, France and Greece. Israel is the leader among the SEMCs when it comes to reuse of treated wastewater (with a rate of over 85% of collected wastewater). Among the EU Mediterranean countries, Cyprus and Malta are the most advanced with 90% and 60% of their treated wastewater reused (UNEP/ MAP and Plan Bleu 2020; IPEMED 2019).
147. The largest producers of freshwater through desalination in 2019 were Israel (645 million m3), Algeria (631 million m3), Spain (405 million m3) and Egypt (200 million m3). Malta is the desalination leader in terms of percentage of desalinated water in national water consumption, with more than half of its drinking water supply produced via desalination (UNEP/MAP and Plan Bleu 2020). Morocco produced 6.3 million m3 of desalinated water on its Mediterranean coast in 2022 (ONEE Water Branch). The available projections suggest that the production of desalinated water in the Middle East and North Africa (MENA) region will increase thirteen times by 2040 in comparison with 2014 (Ibid.)
148. According to De Roo et al., the Mediterranean is a water scarce region already under current climate and water use conditions, with high ratios of water abstraction and consumption compared to water availability, where regional groundwater depletion is already an issue. Under the scenario of global warming of 2°C, projections indicate that the water availability in the Mediterranean could decrease by 10 – 30% locally. In such a context, implementation of irrigation and urban water efficiency measures gains importance. Water reuse is seen as an important measure to reduce abstractions, but the costs of treatment for reuse (as per the new EU standards) may exceed the current willingness to pay for water in agriculture. Desalination could become an increasingly applied option (De Roo et al. 2021).
149. Anthropogenic water abstractions are likely to impact freshwater-seawater dynamics in the Mediterranean basin, in combination with natural and climate-change induced variations of water flow into the sea. Water abstractions include both freshwater abstractions from the catchments that change the characteristics of freshwater reaching the coastal and marine environment, and coastal saltwater abstractions for the purpose of producing drinking water via desalination.
150. Freshwater abstractions in catchments may result in diversions and reductions in freshwater flow, alterations of timing and rates of flow to estuarine and coastal systems, and/or adverse water quality conditions with major changes in nutrient loading. This can affect sediment loads, pH, temperature, salinity, clarity, oceanography and nutrients. The effects of such changes can include mortality, changes in growth and development, and in some cases movement of organisms (Gillanders and Kingsford 2002).
151. Desalination is the process of removing salts from water. A by-product of this process is toxic brine which can degrade coastal and marine ecosystems unless treated. For every litre of potable water produced, about 1.5 litres of liquid polluted with chlorine and copper are created in most desalination processes. The toxic brine depletes oxygen and impacts organisms along the food chain when pumped back into the sea (UNEP 2019). Desalination also comes with a high energy demand. Using renewable energy sources for desalination can be an option to mitigate carbon emissions stemming from desalination.
Wastewater and waste disposal
Waste generation in the Mediterranean
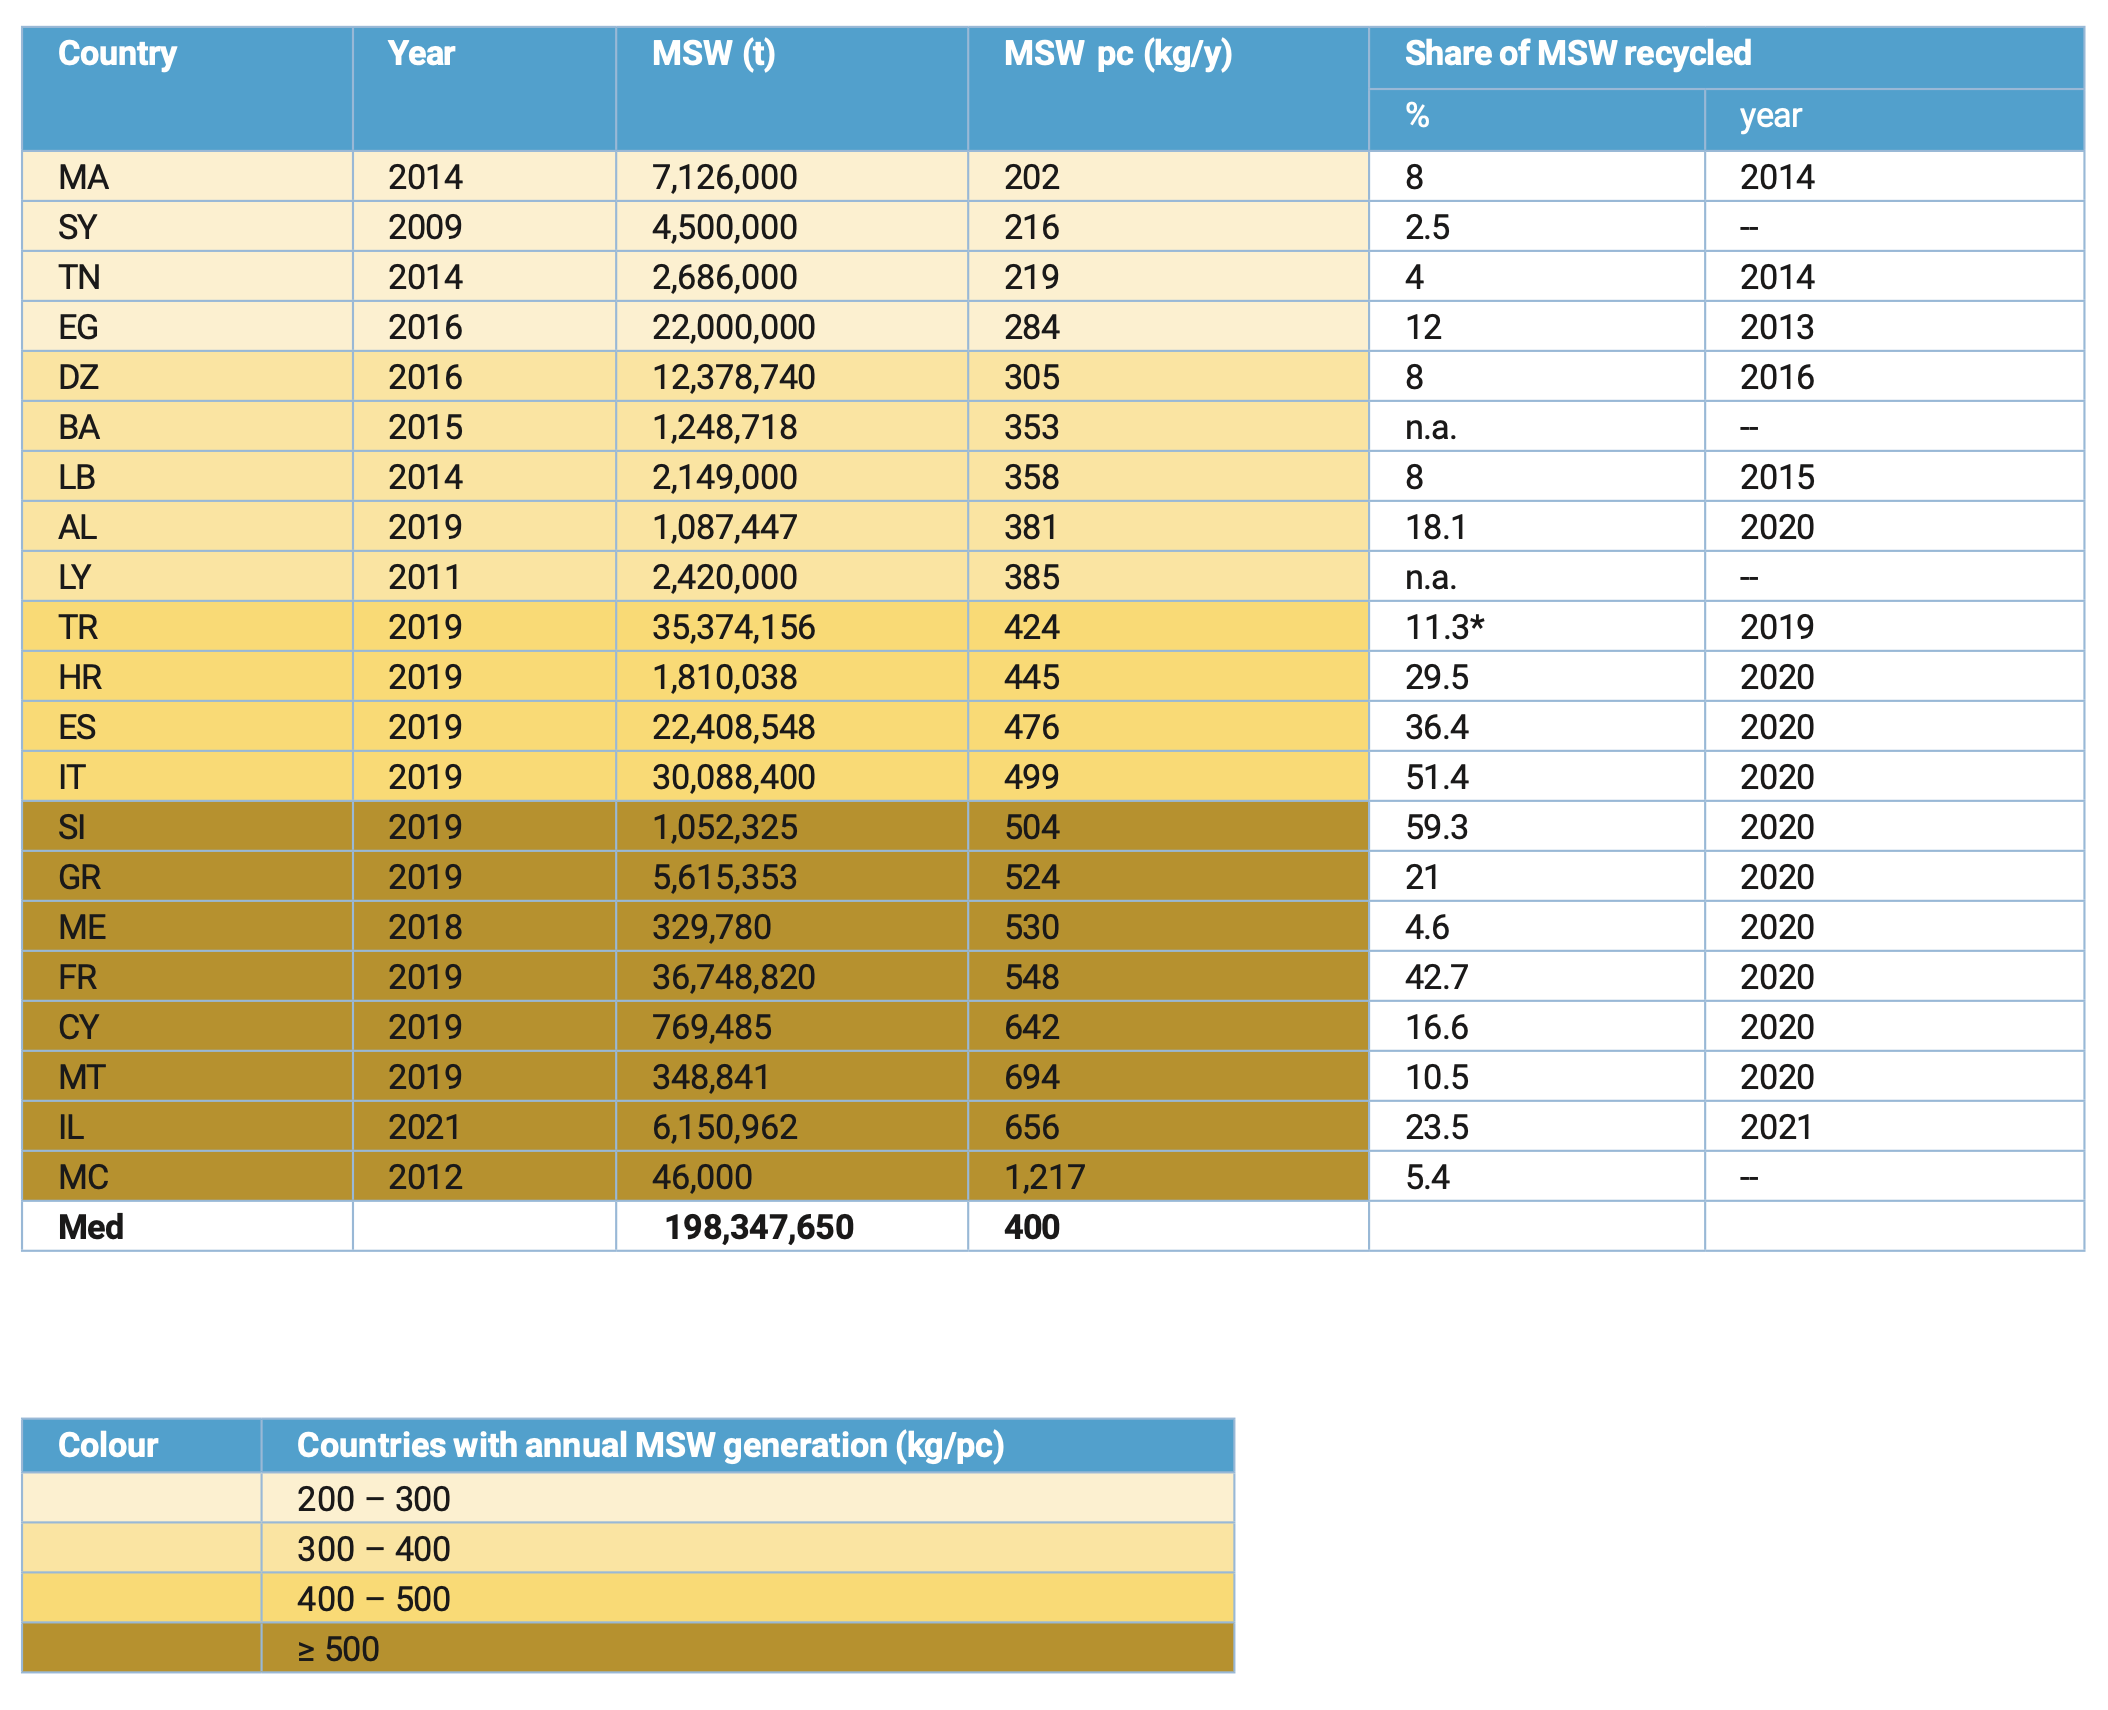
152. According to the latest available data (as presented in Table 9), more than 198 million of tonnes of municipal solid waste (MSW) is generated in the Mediterranean countries37 annually – an average of around 400 kg per capita per year (or 1.1 kg a day), ranging from less than 0.6 kg/day to more than 3.3 kg/day.
Table 9: Municipal waste generation and recycling rates in Mediterranean countries38
Note: own calculation based on the data from EEA and UNEP/ MAP, 2021 and on data from the Ministry of Environmental Protection of Israel, 2023. Sources: World Bank What a Waste Global Database39, EEA and UNEP/MAP, 2021, EEA, 2023, Ministry of Environmental Protection of Israel, 2023
37, 38, 39
37 Close to 97 million in the SEMCs and around 101 million in the NMCs. The regional/ sub-regional sums were derived from the data referring to 2019 for most NMCs and Türkiye, while the last available data for the SEMCs mainly refer to the period 2014 – 2016; data for Syrian Arab Republic and Libya were only available for 2009 and 2011 (respectively).
38 Covering all marine façades of multi-façade countries.
39 According to the World Bank, information presented in the database is the best available based on a study of current literature and limited conversations with waste agencies and authorities. While it is recognized variations in the definitions and quality of reporting for individual data points might exist, the general trends depicted by the database records are believed to be representative of the global reality.
153. Total quantities of e-wastes generated in the Mediterranean countries are at the level of 8.3 millions of tonnes, while generation of hazardous wastes exceeds 28.5 millions of tonnes annually (World Bank database, accessed January 2023).
154. As regards the MSW composition, organic materials represent the main fraction in most of the SEMCs, accounting for as much as 68% in Tunisia and 70% in Libya (World Bank database, accessed January 2023). Share of plastics ranges from few percent to more than a fifth of the total quantity and is generally higher in the NMCs (Ibid.).
155. MSW generation has been increasing across the Mediterranean and a growing trend is expected to continue in the coming decades. While municipal waste generation in the NMCs is significantly higher compared to the SEMCs, waste management systems are more advanced. Despite notable improvements, collection of MSW is still a significant issue in most SEMCs where only a few countries are succeeding in reaching full waste collection coverage (EEA and UNEP/ MAP 2021), whereas collection services are, as a rule, underdeveloped in rural areas, suburbs and slums.
156. According to EEA and UNEP/ MAP report (2021), more than a half (54%) of total MSW is, on average, disposed at open dumps in the SEMCs40, while the share goes to as high as 80% in some countries. Landfilling (different types of landfills) has been reported as the main disposal option in Algeria (accounting for 89% of total MSW), Israel (75%) and Tunisia (70%). On the other hand, the overall landfill rate – waste sent to landfill as a share of generated waste – decreased from 23% to 16% during 2010 and 2020 in the EU as a whole, in line with the objective of reducing reliance on landfilling; total quantity of waste sent to landfill in this period decreased by 27.5% – from 173 million tonnes to 125 million tonnes41.
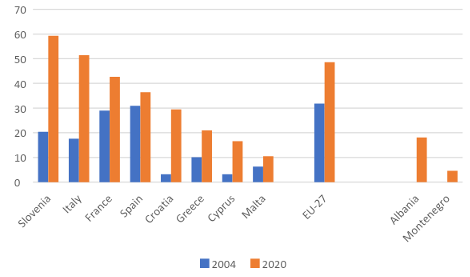
157. Reported recycling rates are mainly below 10% in the SEMCs, except for Egypt where the rate is higher (12%) due to a significant impact of informal recycling activities, and Israel (where nearly a quarter of MSW is recycled). Recycling rates are also low in Türkiye (around 11%) as well as in the non-EU NMCs as well as in the non-EU NMCs (Table 9); with a recycling rate of 18.1% in 2020, Albania made a significant step forward in recent years (Figure 21). Over the past 15 years, the EU Mediterranean countries made significant progress with recycling, with Slovenia and Italy doubling the recycling rates and countries like Croatia and Cyprus increasing the rates by as much as eight and four times respectively (Figure 21). Nevertheless, recycling rates in most EU Mediterranean countries (the only exceptions being Slovenia and Italy) were well below the EU-27 average and are particularly low in Malta (10.5%) and Cyprus (16.6%).
40, 41
40 Including Jordan.
41 https://www.eea.europa.eu/ims/diversion-of-waste-from-landfill accessed January 2023.
Figure 21: Recycling rates in the Mediterranean EU Member States, Albania and Montenegro (2004 and 2020).
Source: https://www.eea.europa.eu/ims/waste-recycling-in-europe accessed February 2023.
Wastewater
158. Total municipal wastewater generation in the riparian countries of the Mediterranean Sea was at the level of 32,872 million m3 (Mm3) per year (Table 10). Around three quarters of produced wastewater (24,847 Mm3) were treated (FAO 2023), with uneven treatment shares across the region.
Table 10: Generation and treatment of municipal wastewater, 2017-2019
| Countr y | Municipal WW (Mm3/year) | Treated WW share (%) | |
| produced | treated | ||
| AL | 54.0* | 20.5 | 38.0 |
| DZ | 1,500.0 | 400.0 | 26.7 |
| BA | 82.3 | 57.0 | 69.2 |
| HR | 360.0 | 300.0 | 83.3 |
| CY | 30.0 | 30.0 | 100.0 |
| EG | 7,078.0 | 4,282.0 | 60.5 |
| FR | 4,000.0 | 3,770.0 | 94.3 |
| GR | 568.0* | 568.0 | 100.0 |
| IL | 500.0 | 450.0 | 90.0 |
| IT | 3,926.0 | 3,902.0 | 99.4 |
| LB | 310.0 | 56.0 | 18.1 |
| LY | 504.0 | 40.0 | 7.9 |
| MT | 26.0 | 24.0 | 92.3 |
| MC | 8.0 | 6.0 | 75.0 |
| ME | 31.0 | 9.5 | 30.6 |
| MA | 700.0 * | 166.0 * | 23.7 * |
| SI | 241.0 | 158.0 | 65.6 |
| ES | 5,870.0 | 5,465.0 | 93.1 |
| SY | 1,370.0 | 550.0 | 40.1 |
| TN | 312.0 | 274.0 | 87.8 |
| TR | 5,280.0 | 4,236.0 | 80.2 |
| Med | 32,872.3 | 24,847.0 | 75.6 |
*Notes: For Albania, data on produced wastewater was used as reported in EEA and UNEP/ MAP, 2021 (data recorded in the database seems to be an outlier). For Greece, data on produced municipal wastewater was not available in the database; data on collected wastewater is recorded instead. For Morocco, alternative data with different reference years is available as follows: Volume of wastewater produced by households 1,513.46 1000M3/day in 2015 (Source: Eurostat, ONEE/Water Branch), Volume of wastewater treated in urban wastewater treatment plants 1,027 1000M3/day in 2019 (Source: Eurostat, ONEE/Water Branch), ratio of treated wastewater 56% in 2020 (Source: 4th Report on the State of the Environment of Morocco).
Source: FAO AQUASTAT Core Database accessed on 17 February 2023.
159. The analysis conducted for the EEA and UNEP/ MAP report (2021) showed that wastewater generation was on the rise across the region (resulting mainly from population growth and fluctuations from tourism), as was the case with wastewater collection and treatment. The largest volumes are generated by the Mediterranean EU countries, where almost all the produced municipal wastewaters (96% on average) are treated. While significant progress with wastewater treatment has been achieved in the non-EU NMCs and most of the SEMCs during the past decade, significant volumes (estimated at around 5 km3/year) of wastewater are still discharges untreated into the environment, streams, wadis or directly into the sea (EEA and UNEP/ MAP 2021). The instability in Lebanon, Libya and Syrian Arab Republic have either resulted in the shutting down of wastewater treatment plants or the suspension of constructing new ones (Ibid.).
160. Inadequate levels of treatment are a key challenge in the Mediterranean, with 21% of treated wastewater (25% in southern countries) undergoing only basic treatment, and less than 8% (1% in southern countries) undergoing tertiary treatment (UNEP/MAP and Plan Bleu 2020; EEA and UNEP/MAP 2021).
161. The achieved progress with waste and wastewater management is not sufficient to curb the pressures and that further reduction in key pressures, such as waste and marine litter, wastewater and industrial emissions, is required to achieve a clean Mediterranean and the Good Ecological Status of its sea.
Infrastructure: underwater cables and pipelines
Underwater cables
162. Over the past 15 years, the Mediterranean region has seen a rapid spread of information and communication technologies (ICTs), with, for example, the total number of mobile cellular telephone subscriptions doubling between 2005 and 2021 to exceed 580 million. The share of the population using the internet has increased by several folds in a number of countries, most notably in Albania and Algeria, but also in Lebanon, Tunisia, Syrian Arab Republic, Egypt, Morocco and Türkiye. As of 2021, the share of internet users in the national populations is above 70% in almost all the Mediterranean countries, and above 90% in Cyprus, Israel and Spain. The number of mobile-cellular subscriptions per 100 inhabitants is the lowest in Libya (around 43) and remains below 100 in Albania, Egypt, Lebanon and Syrian Arab Republic.
163. Submarine cables are deployed in an imbalanced way throughout the Mediterranean Sea, promoting connections of the most developed regions of the world. This contributes to maintaining a digital divide for the SEMCs where despite remarkable progress, significant shares of the population remained excluded from the use of ICTs (because of inability to access technologies or lack of skills to use them). The digital transition seemed to be slower and mainly focused on urban areas in Algeria, Egypt, Libya, Tunisia and Syrian Arab Republic (UNEP/ MAP and Plan Bleu 2020).
Pipelines
164. An overview of the existing and planned oil and gas pipelines (onshore and underwater) for the Mediterranean is not available.
165. One of the older gas conveyors is the 2,475 km long Trans-Mediterranean Pipeline built in 1983 to transport natural gas from Algeria to Italy via Tunisia and Sicily, with a capacity of more than 33.5 billion cubic metres a year (bcm/ yr)42. Several new gas pipelines, such as the Trans-Adriatic and EastMed Pipelines are planned to respond to the need for an increased gas supply to Europe and to diversify natural gas import routes by the EU. The recent construction of the TANAP (Trans- Anatolian Pipeline) is planned to establish a connection to the Trans-Adriatic Pipeline to reach Greece and Italy, and provide the EU with access to 16 bcm/ yr of gas extracted by Azerbaijan from the Caspian Sea (UNEP/ MAP and Plan Bleu 2020).
42https://www.hydrocarbons-technology.com/projects/trans-med-pipeline/
Coastal development and artificialisation of coastline
166. Due to a range of amenities (including favourable climate, landscape, cultural, recreational and other benefits) and development and employment opportunities (activities analysed above), Mediterranean coastal areas are among the most sought-after areas. They are frequently an end point for internal migration flows, including rural – urban population movements, and coastal areas are also highly valued as locations for secondary/ holiday homes. Through this high density of human presence and activity, the coastal zone concentrates pressures on the environment.
167. The total length of the Mediterranean coasts is more than 57,000 km (UNEP-GRID 2017). Many of the major cities in Mediterranean countries are located on the coast. The share of urban population increased steadily across the region, standing at or above 70% in over half the countries (Algeria, France, Greece, Israel, Italy, Lebanon, Libya, Spain, Malta, Tunisia, Türkiye) in 2021. Egypt is the only Mediterranean country where rural population (around 57% in 2021) still prevails, while the shares of rural and urban population are about the same in Bosnia and Herzegovina (World Bank 2022).
Figure 22: Shares of urban population across the Mediterranean 1975 – 2021
Source: World Development Indicators | DataBank (worldbank.org), accessed November 2022.
168. Approximately one third of the total Mediterranean population (170 – 180 million in 2021) lives in coastal areas. Shares of coastal population range from 5% in Slovenia to 100% in island countries (Cyprus, Malta) and Monaco. Population densities in coastal areas have continued to increase at unsustainable rates over the last decade. Rapid growth of urban and peri-urban areas is recorded all over the Mediterranean.
169. Intensification of coastal uses is at the origin of many impacts that alter the invaluable capital that is the Mediterranean, leading to increased fragmentation of landscapes, disrupting ecological continuity and degrading the environment’s capacity to provide ecosystem services to society. It also makes coastal zones highly vulnerable to sea level rise, storm surges, flooding and erosion (UNEP/MAP and Plan Bleu 2020; Grimes et al. 2022).
170. A detailed analysis of the location and extent of the habitats potentially impacted by hydrographic alterations, the length of coastline subject to physical disturbance due to the influence of human-made structures, and land cover change is given in the 2023 MED QSR chapter on coast and hydrography.
Fertiliser and pesticide use in agriculture
Figure 23: Pressures exerted by agriculture on the marine environment.
Source: UNEP/MAP and Plan Bleu 2020.
171. The main impacts of agriculture on the marine environment are due to the runoff of nutrients and agro-chemicals into the sea. Disaggregation of the impact from different sources of land-based pollution is difficult and there is no quantitative data concerning the effect of agriculture on the environment of the Mediterranean Sea. The runoff of inorganic nitrogen and phosphorus fertilizers leads to eutrophication, which in turn negatively impacts coastal and marine ecosystems. The runoff and infiltration of pesticides into the sea affect the marine environment at a slower pace by bioaccumulation higher up the food chain (UNEP/MAP and Plan Bleu 2020).
172. In 2020, fertilizer consumption in kg/ha of arable land ranged from 7 kg/ha in Syrian Arab Republic to 473 kg/ha in Egypt, with half of the Mediterranean countries being above and half of the Mediterranean countries being below the world average fertilizer consumption of 146 kg/ha of arable land (World Bank 2023).
Table 11: Fertilizer consumption in kg/ha of arable land, in Mediterranean countries, 2017-2020
| Country | 2017 | 2018 | 2019 | 2020 |
| AL | 100 | 67 | 94 | 101 |
| BA | 106 | 85 | 87 | 90 |
| CY | 175 | 158 | 188 | 163 |
| DZ | 21 | 21 | 21 | 21 |
| EG | 574 | 522 | 495 | 473 |
| ES | 155 | 158 | 157 | 167 |
| FR | 178 | 172 | 157 | 169 |
| GR | 130 | 135 | 141 | 150 |
| HR | 214 | 221 | 212 | 200 |
| IL | 230 | 241 | 231 | 140 |
| IT | 130 | 130 | 128 | 136 |
| LB | 293 | 275 | 279 | 249 |
| LY | 26 | 16 | 19 | 15 |
| MA | 60 | 63 | 65 | 58 |
| MC | no data | no data | no data | no data |
| ME | 234 | 247 | 252 | 307 |
| ML | 93 | 89 | 96 | 127 |
| SI | 257 | 262 | 255 | 256 |
| SY | 3 | 2 | 7 | 7 |
| TN | 49 | 57 | 57 | 57 |
| TR | 132 | 110 | 126 | 150 |
| World | 141 | 140 | 138 | 146 |
Source: World Bank 2023
173. The consumption of pesticides in the Mediterranean basin varies largely between countries. In 2020, the average use of pesticides in kilograms per hectare of cropland ranged from 0.3 kg/ha in the Syrian Arab Republic to 14.5 kg/ha in Israel. Almost two thirds of the Mediterranean countries showed pesticide consumption above the world average of 1.8 kg/ha (FAOstat 2023). Pesticides, especially if used irrationally, can lead to animal and human health problems such as the inability to reproduce normally in certain animal species, or cancer, neurological effects, diabetes, respiratory diseases, foetal diseases, and genetic disorders in humans who have been directly or indirectly exposed to certain pesticides (UNEP/MAP and Plan Bleu 2020). Managing this type of pollution is particularly difficult because of its diffuse nature and largely unknown combined effects of multiple types of pesticides and their life cycles in the terrestrial and marine environment.
Table 12: Use of pesticides in kg/ha of cultivated land, in Mediterranean countries, 2017-2020
|
|
2017 |
2018 |
2019 |
2020 |
|
AL |
0.9 |
0.6 |
1.1 |
1.1 |
|
BA |
2.2 |
2.3 |
2.2 |
2.4 |
|
CY |
9.7 |
9.6 |
10.3 |
9.2 |
|
DZ |
0.7 |
0.7 |
0.7 |
0.7 |
|
EG |
2.6 |
2.9 |
2.9 |
2.9 |
|
ES |
3.6 |
3.3 |
2.6 |
2.6 |
|
FR |
3.6 |
4.5 |
2.9 |
3.4 |
|
GR |
2.6 |
3.5 |
3.4 |
3.3 |
|
HR |
1.8 |
1.9 |
1.7 |
1.7 |
|
IL |
14.3 |
15.2 |
14.6 |
14.5 |
|
IT |
6.1 |
5.9 |
5.2 |
6.1 |
|
LB |
6.6 |
6.7 |
6.7 |
6.7 |
|
LY |
0.3 |
0.4 |
0.4 |
0.4 |
|
MA |
1.4 |
1.4 |
1.6 |
1.5 |
|
ME |
6.2 |
6.2 |
6.1 |
6.2 |
|
SI |
4.6 |
5.0 |
4.2 |
4.1 |
|
SY |
0.3 |
0.3 |
0.3 |
0.3 |
|
TN |
0.5 |
0.7 |
0.7 |
0.7 |
|
TR |
2.3 |
2.6 |
2.2 |
2.3 |
|
World |
1.9 |
1.8 |
1.8 |
1.8 |
Source: FAOstat 2023.
Table 13: Agricultural use of pesticides in tons
|
|
2017 |
2018 |
2019 |
2020 |
|
AL |
6,067 |
6,067 |
6,067 |
6,067 |
|
BA |
2,517 |
2,545 |
2,514 |
2,723 |
|
CY |
1,163 |
1,246 |
1,271 |
1,218 |
|
DZ |
615 |
442 |
730 |
757 |
|
EG |
9,988 |
11,352 |
11,352 |
11,352 |
|
ES |
60,896 |
55,223 |
43,337 |
43,337 |
|
FR |
70,604 |
85,072 |
54,381 |
65,216 |
|
GR |
8,503 |
11,199 |
11,032 |
10,475 |
|
HR |
1,570 |
1,677 |
1,558 |
1,644 |
|
IL |
6,881 |
7,322 |
6,983 |
6,983 |
|
IT |
56,641 |
54,153 |
48,567 |
56,556 |
|
LB |
1,816 |
1,816 |
1,816 |
1,816 |
|
LY |
649 |
788 |
788 |
788 |
|
MA |
13,697 |
13,697 |
13,697 |
13,697 |
|
ME |
91 |
91 |
91 |
91 |
|
MT |
98 |
89 |
102 |
102 |
|
SI |
1,087 |
1,172 |
972 |
949 |
|
SY |
1,422 |
1,422 |
1,422 |
1,422 |
|
TN |
2,670 |
3,211 |
3,511 |
3,511 |
|
TR |
54,098 |
60,020 |
51,297 |
53,672 |
Source: FAOstat 2023.
A need to anticipate emerging and fast-growing new activities
174. Faced with the lack of space along coastlines and the pressure of emerging maritime activities, the permanent occupation and exploitation of the sea is developing from the coast to offshore: creation of artificial islands, ports, and wind farms, telecommunications and energy cables as well as pipelines; exploration and exploitation of until now untouched marine resources, represent a new field of experimentation, development, impact and potential conflict. The increasing presence of infrastructure at Sea, and particularly infrastructure of strategic importance for energy and data/communications supply, also comes with a need for countries to protect this infrastructure in a generally tense geopolitical and security context faced in the Mediterranean.
Therefore, some of the activities at Sea are likely to trigger the emergence of other potentially polluting activities at Sea, including surveillance activities and potentially military interventions. New activities at Sea seldomly limit their presence and impact to the Sea because they need to be connected to the shore in order to allow use of their products on land (energy, minerals, landing terminals and hinterland infrastructure onshore, …). All of these activities modify – at least temporarily – the marine and/or coastal environment. Making these activities compatible with GES, already in the planning phase, is therefore essential for the achievement of GES in the Mediterranean.
Knowledge gaps
175. This chapter provides an analysis of the main socio-economic components that influence the Mediterranean coastal and marine environment. Analysis is based on available data from a number of different sources, such as UN system data, data from international organisations, and relevant scientific articles. The absence of a comprehensive monitoring system of socio-economic characteristics and the sustainability of economic activities makes it difficult to establish clear links between the quality status of the Mediterranean Sea (analysed in the following chapters) and the social and economic pillars of sustainable development (analysed in this chapter). In particular, while a certain level of information on demographic, economic and employment has been collected, literature review did not adequately inform the level of environmental and social sustainability of human activities that impact the coastal and marine environment. A knowledge gap remains in measuring to what extent human activities are compatible or in line with the objective of achieving GES and clear sustainability indicators of human activities are generally lacking.
1. The Mediterranean Sea
Environmental Characteristics
Socioeconomic characteristics
Regional
Cooperation


