2023 MED QSR WEB SITE INDEX
Ecological objectives and their related Common Indicators
E07 Hydrography
EO8 Coastal ecosystems and landscapes
E07 Hydrography
EO7 Alteration of hydrographical conditions
Methodology:
- The EO7 Common Indicator 15 reflects the location and extent of the habitats impacted directly by hydrographic alterations due to new developments (QSR 2017, 2018), i.e., upcoming constructions. It concerns area/habitat and the proportion of the total area/habitat where alterations of hydrographical conditions are expected to occur. The GES is achieved when negative impacts due to a new structure are minimal with no influence on the larger scale coastal and marine system.In relation to the 2017 Med QSR countries still have difficulties to provide monitoring data according to the Guidance Factsheet, although the methodology has been The information received by majority of the countries is of a descriptive nature, rather inhomogeneous, regardless of the same annotated questionnaire developed in the frame of the EcAp MED III and IMAP MPA projects. However, some scientific partners provided very relevant information of the hydrographic parameters based on satellite data and mainly related to climate change impacts. It seems that all these parameters that are increasing their values due to climate change have significant impacts on all other EOs and should be taken into account for an integrated assessment.
- No monitoring data were reported so GES assessment could not be made according to the Guidance Factsheet (UNEP/MAP, 2019). Therefore, for this assessment other sources of information were used to provide a general overview of the hydrography in the Mediterranean, such as national reports prepared in the context of the EcAp MED III project, IMAP MPA project and by some other countries, and those provided by the scientific partners (i.e., Mercator Ocean) in particular on hydrographic parameters that are changing due to climate change.
Common Indicator 15: Location and extent of the habitats impacted directly by hydrographic alterations
1259. Large-scale coastal and off-shore developments have the potential to alter the hydrographical regime of currents, waves and sediments in marine environment (UNEP/MAP/PAP, 2015). To address this, UNEP/MAP has included the Ecological Objective 7 “Alteration of hydrographical conditions”, as part of the IMAP of the Mediterranean Sea and Coast (UNEP/MAP, 2016a). EO7’s Common Indicator 15 “Location and extent of habitats impacted directly by hydrographic alterations” considers marine habitats which may be affected or disturbed by changes in hydrographic conditions due to new developments. The main target of this indicator is to ensure that all possible mitigation measures are taken into account when planning the construction of new structures, in order to minimize the impact on coastal and marine ecosystem and its services, integrity, and cultural/historic assets. Good environmental status (GES) regarding EO7 Hydrography is achieved when negative impacts due to new structures are minimal with no influence on the larger scale coastal and marine systems.
Key Messages (CI15)
1260. All countries had difficulties with the monitoring of this indicator according to the Guidance factsheet and could not provide monitoring data therefore, the Good Environmental Status has not been assessed. GES should be defined in close coordination with the EO1 and EO6.
1261. A baseline assessment has been made using data from the national reports prepared in the frame of EcAp MED III and IMAP MPA projects, including some other countries that used the same report format, and from the data provided by scientific partners, Mercator Ocean in particular.
1262. Climate change seems to have far bigger impacts on the habitats and marine ecosystems in long term, however at a local scale the hydrographic alterations caused by coastal structures can have a significant and direct impact on coastal habitats.
1263. Due to the difficulties that countries have with reporting on this indicator further simplification of the Guiding Factsheet is needed so to allow countries to report on the physical loss of habitats, i.e., the footprint of the structure on seabed habitats.
Key assessment findings per theme / indicator
1264. GES has not been assessed for EO7 CI 15 because countries had difficulties to monitor this indicator according to the Guidance Factsheet and therefore, monitoring data was not provided.
1265. There are insufficient surveys and monitoring data provided by the countries according to the Guidance Factsheet. This is mainly related to the complex and demanding methodology, as well as institutional and scientific capacities. Assessments that estimate the extent of hydrographic alterations (knowing conditions before and after construction) and its intersection with marine habitats were not provided. Also, related studies such as EIA and SEA reports are either publicly inaccessible or conducted by various different methods. The use of numerical models in EIA to assess hydrographic alterations is costly and time-consuming and requires technical expertise and knowledge as well as statistically significant sets of hydrographic parameters;
1266. The link to EO1 and EO6 is essential for this indicator. Maps of benthic habitats in the zone of interest (broad habitat types and/or particularly sensitive habitats) are required. Therefore, identifying the priority benthic habitats for consideration in EO7, together with assessment of impacts, including cumulative impacts is a cross-cutting issue of priority for EO1, EO6 and EO7. Efforts need to be given to detect the cause-consequence relationship between hydrographic alterations due to new structures and habitat deterioration (i.e., scientific gaps and uncertainties exist).
1267. Spatial resolution and temporal scope (historic data) of openly available spatial data on hydrographic alterations (i.e., CMEMS products) are not sufficient. Due to the scale of the locations where structures are constructed or planned are rather local (micro-location).
1268. Although there are certain systematic databases of spatial data (e.g., EMODnet, CMEMS), the availability and spatial resolution of certain spatial data varies significantly at the level of countries (for example, Malta and Slovenia have bathymetric data measured by LIDAR technology, while some countries do not have these at all).

Measures and actions to achieve GES in relation to CI15
1269. Establishment of the national IMAP, monitoring programme that will systematically collect statistically significant data of the hydrographic parameters is required – first, to allow modelling of hydrographic alterations of the planned structures at the very local scale in the EIA/SEA and second, to provide subsequent monitoring data once the structures have been built. A close cooperation has to be established with the authorities that are responsible for planning of such structures including those responsible for EIA. In parallel, mapping of habitats in a surrounding area that could possibly be impacted by such hydrographic alterations should be prepared (link to EO1 and EO6).
1270. Creation of a digital spatial database of all data from EIA/SEA including spatial coverage and location of the intervention, existing and planned structures and marine habitats. The Copernicus Marine services, the EMODnet service and the spatial planning information system of individual countries (via WMS or WFS layers) (Baučić et al., 2022b) should be used, thus providing necessary data for the CI 15 assessments and monitoring.
1271. As the rational possibility, a revision of the existing indicator Factsheet should be considered that will simplify the method to allow countries to report on the physical loss of habitats, i.e., the structure’s footprint only.
1272. Considerations should also be given to the possibility of proposing a set of climate change related indicators in the frame of IMAP. This could include monitoring of hydrographic parameters (e.g., salinity, temperature, waves and currents) that are changing rapidly due to climate change. The use of hydrographic parameters reported within EO 5 on eutrophication should be taken into account with the use of remote sensing and other available sources for climate change in order to determine the hydrographic alterations in the Mediterranean region. In-situ data are equally important and should be used to monitor changes in variables due to climate effects that is required also by the EU Marine Strategy Framework Directive (MSFD). Such alterations may have much stronger impacts on marine habitats and ecosystems than those monitored by the CI 15 itself.

E08 Coastal ecosystems and landscapes
1273. EO8 focuses on the terrestrial part of the coastal areas where human activities are continuously altering coastal ecosystems and landscapes. The objective of EO 8 is to ensure that the natural dynamics of coastal areas are maintained and coastal ecosystems and landscapes are preserved. The monitoring under EO 8 addresses coastal artificialisation: construction of buildings and infrastructure along the coastline (such as defence structures, ports and marinas, etc.) and land cover change in accordance with the Guidance factsheet (UNEP/MAP, 2019). Two CIs are established for monitoring coastal artificialisation:
-
- Common indicator 16 (CI 16): Length of coastline subject to physical disturbance due to the influence of human-made structures; and
- Candidate common indicator 25 (CCI 25): Land cover change.
1274. The assessment of CI16 in the 2017 Med QSR was rather subjective as no monitoring data was available at the time. The current assessment is based on the data provided by the majority of the countries and gives a good insight into the baseline status. It will be with the second set of monitoring data when changes could be assessed with regard to GES that is country-specific. A Guiding document has been prepared that includes a list of criteria which may be used by the countries when defining their GES (PAP/RAC, 2021). It was successfully tested in Morocco (PAP/RAC, 2022). The Candidate CI 25 has not been presented in the 2017 Med QSR.
1275. The relationship with other EOs is important with relation to land sea interactions and communication between the terrestrial and marine habitats. Within the Ecological Objective 8 (EO8) however, there is no possibility for integration between the two indicators, i.e., land cover and the coastline, because there is no firm correlation.
1276. For CI 16 data is aggregated from the national reports (seventeen out of twenty Mediterranean countries reported). Assessment results for the candidate CI 25 Land cover change is presented for the Adriatic sub-region.
Common Indicator 16: Length of coastline subject to physical disturbance due to the influence of human-made structures
Methodology:
- Construction of various structures along the coastlines such as ports, marinas, break walls or jetties causes irreversible damage to landscapes, losses in habitat and biodiversity and permanently changes the shoreline configuration, thus disturbing the natural dynamic of coastal Even though coastline structures are sometimes introduced to reduce erosion. Thus, it is of high importance to monitor the length of coastline subject to physical disturbance by human-made structures. The monitoring aim of the CI 16 is twofold: (i) to quantify the rate and the spatial distribution of the Mediterranean coastline artificialisation and (ii) to provide a better understanding of the impact of those structures to the shoreline dynamics.
- CI 16 monitoring entails an inventory of the length and location of human made coastline (hard coastal defence structures, ports, marinas) while soft techniques e.g., beach nourishment are not considered as artificial coastline. Monitoring data of the CI 16 are presented as:
-
- km of artificial coastline and % of total length of coastline;
- percentage (%) of natural coastline in the total coastline
-
- Following the CI 16 methodology, the Contracting Parties prepared the national reports of the CI 16 assessments. The first sets of monitoring data are provided for seventeen out of twenty Mediterranean countries. By summarising the national data, a good overview of the baseline status of CI 16 is obtained for the Mediterranean level, i.e., ratio between the natural and artificial CI 16 is calculated for two periods for Italy, Spain and Malta thus first results showing trends are available, too. The Good Environmental Status (GES) for CI 16 serves to minimise physical disturbance to coastal areas induced by human activities, i.e., whether the coastline has been further developed and country’s specific targets have been achieved. The definition of GES is country-specific and has not yet been defined. Therefore, the assessment will only be possible once country-specific GES are defined, and once the second set of monitoring data is provided by all countries.
1277. The UN Environment/MAP emphasizes the integrated nature of the coastal zone, particularly through consideration of marine and terrestrial parts as its constituent elements required by the Integrated Coastal Zone Management (ICZM) Protocol. The aim of monitoring the EO8 common indicator 16 “Length of coastline subject to physical disturbance due to the influence of human-made structures” is twofold: to quantify the rate and the spatial distribution of the Mediterranean coastline artificialisation; and to provide a better understanding of the impact of those structures to the shoreline dynamics.
1278. GES for Common Indicator 16 can be achieved by minimizing physical disturbance to coastal areas close to the shoreline induced by human activities. Definition of targets, measures and interpretation of results regarding this common indicator is left to the countries, due to strong socio- economic, historic and cultural dimensions in addition to specific geomorphological and geographical conditions.
Key messages for CI16
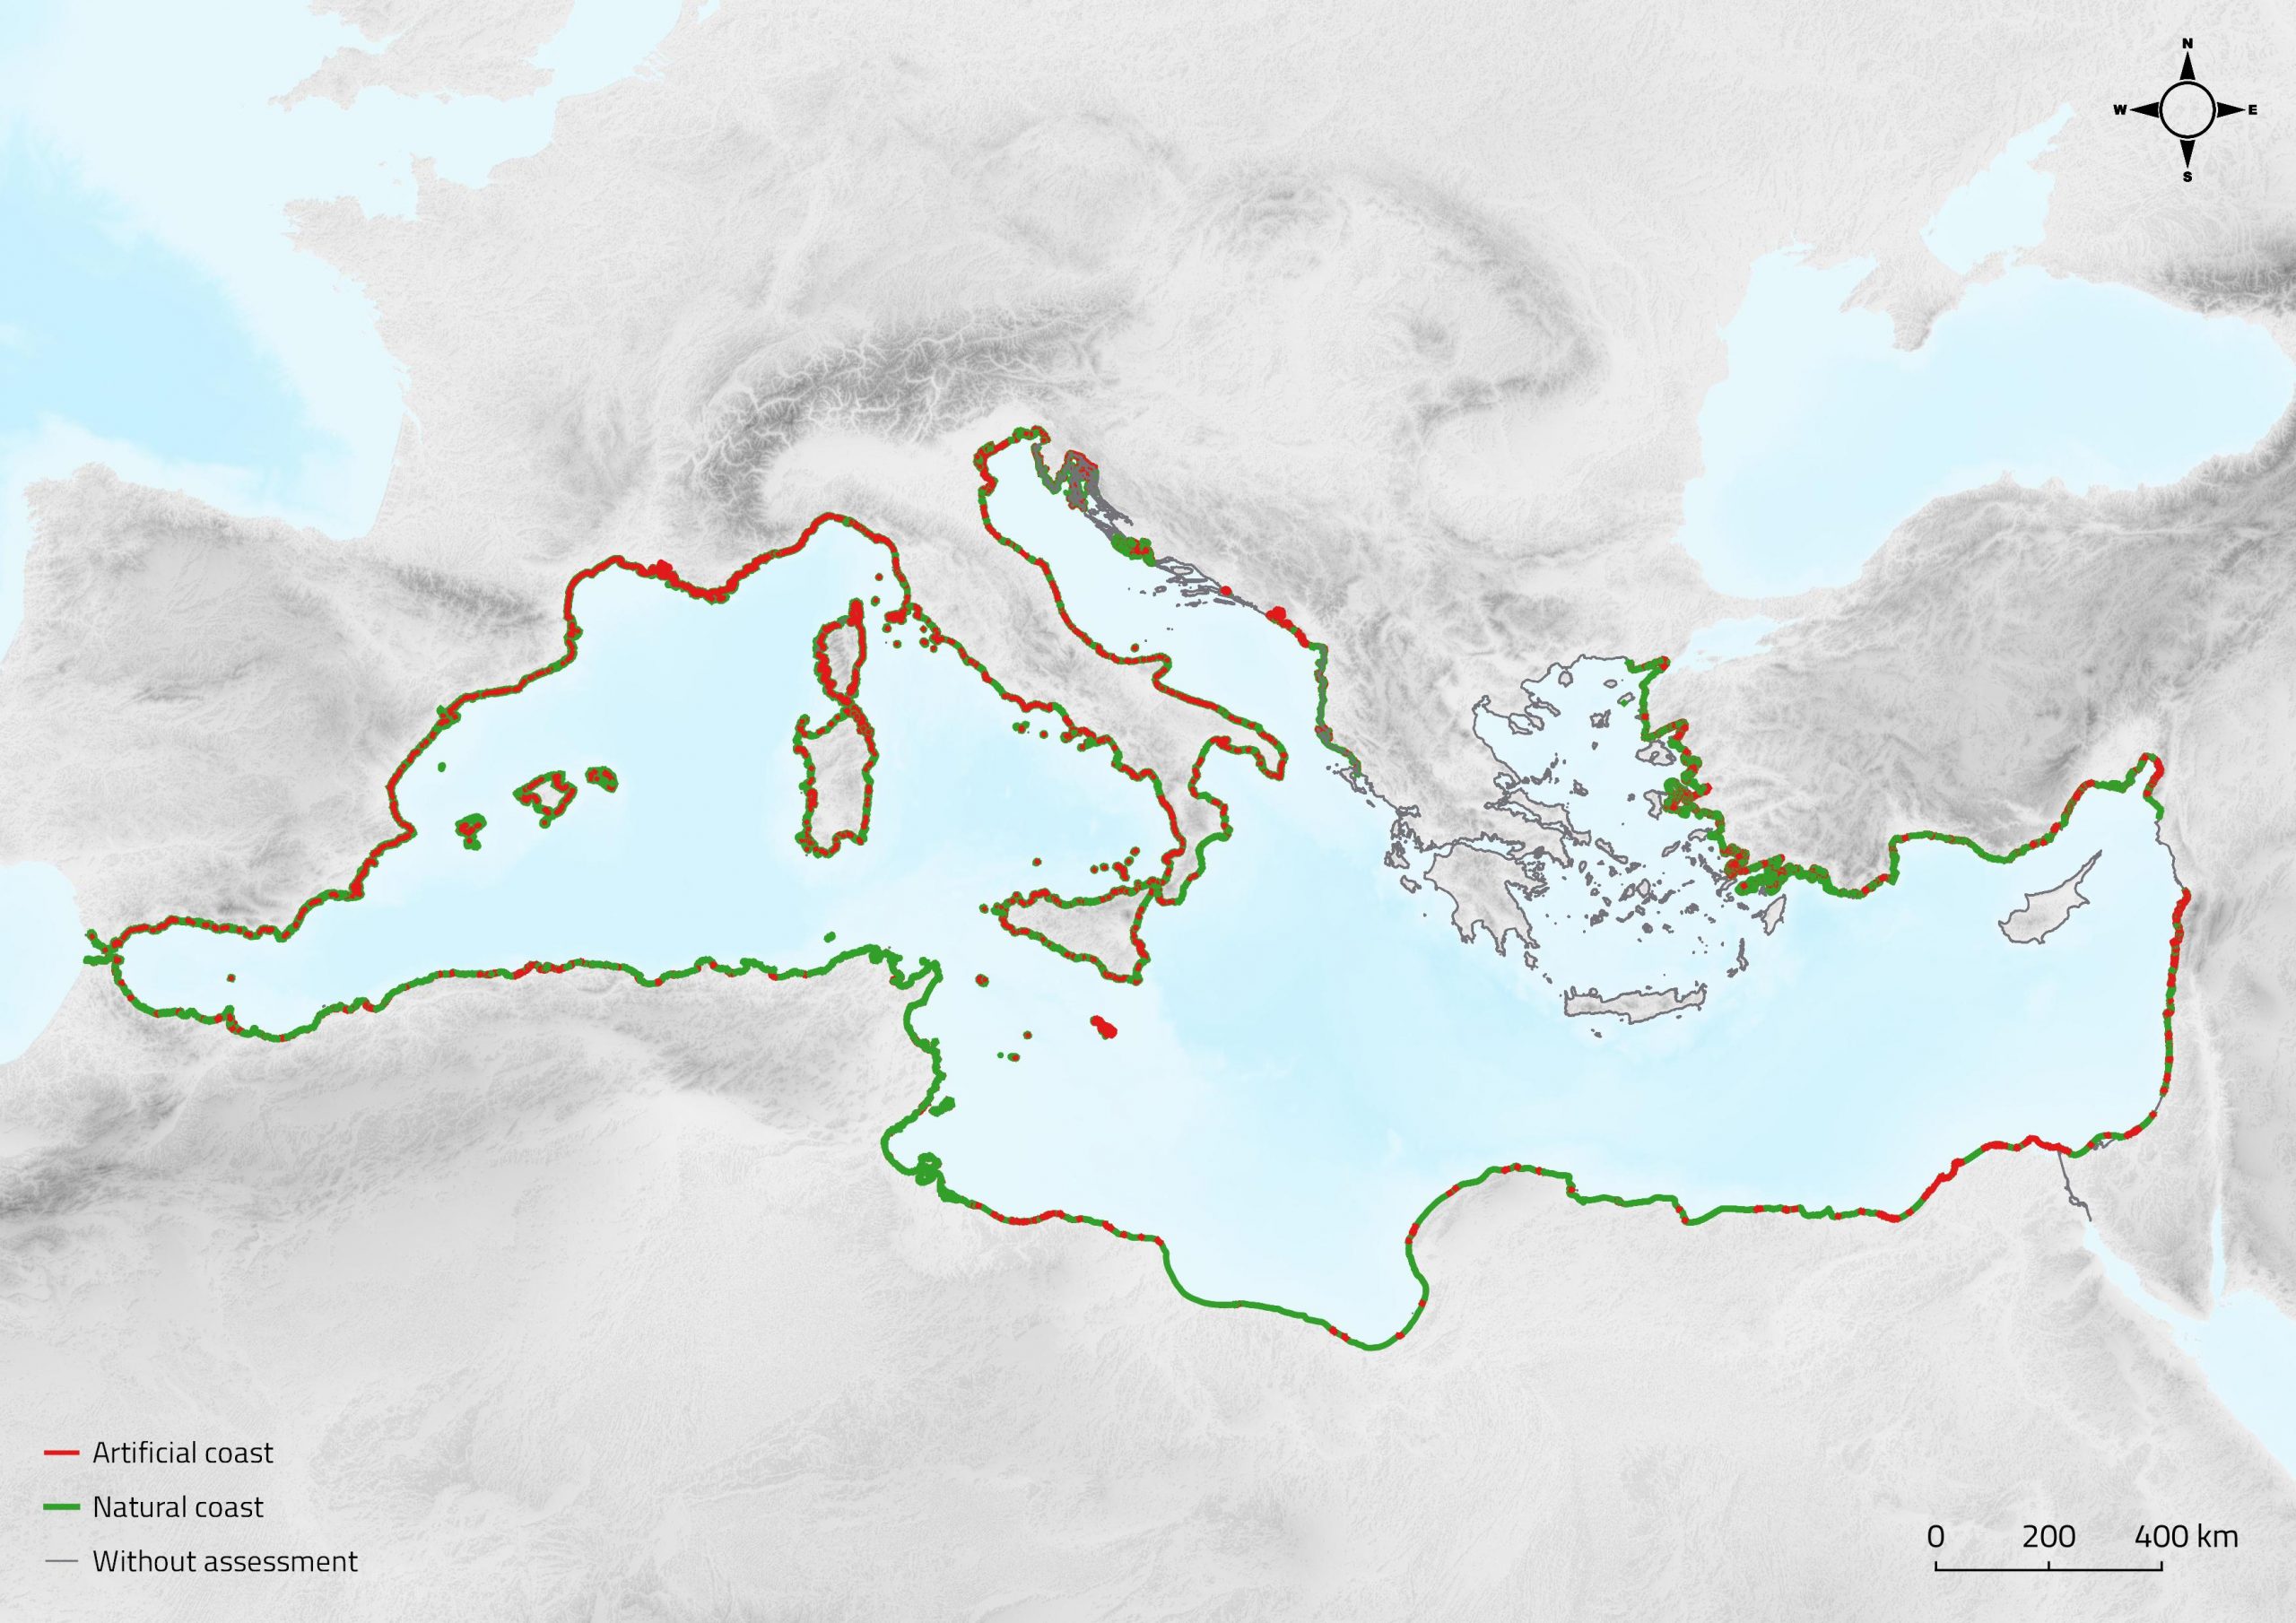
1279. The assessment of CI 16 is done for 31 283 km out of 54,992 km of total Mediterranean coastline (or 57 %) as provided by the national reports referring to various years for baseline data (2018 – 2022) out of which 26 658 km (85.2%) of coast is natural and 4 625 km (14.8%) is artificial. This provides a good overview of the baseline situation (Figure 110).
1280. Two sets of monitoring data were elaborated only for three countries for periods of 6 and 10 years, to observe the change. Change of artificial coast fluctuates around zero (+0.4, – 1.1 and 0,1%) when expressed as a proportion of reference coastline length. In absolute value there is an increase of artificial coastline of 50 km in these three countries.
1281. The majority of human-made structures belong to ports and marinas (49%).
1282. GES could not be assessed because only the first set of monitoring data was provided (except for the three countries that provided two sets of data).
1283. Changes in the percentage or total length of coastline subject to physical disturbance due to the influence of human-made structures could only be assessed for three countries.
Key assessment findings for CI-16
1284. Aggregation of national assessments for CI 16 parameters for the Mediterranean reported here provides the first set of monitoring data. CI 16 assessments are provided for 57% of the Mediterranean coastline or 31 283 km out of which 14.8% or 4,625 km revealed as artificial coast. The proportion (percentage) of artificial coast vary a lot among countries: from 4% to 75% which clearly demonstrates the necessity for country specific GES definitions in terms of percentages or thresholds. Looking at the length of artificial structures, their length is 8 109 km of which 49% have maritime use as ports and marinas (as structures are mapped with all details, they have much longer length then artificial coast itself. Looking at the trend, even for only three countries, there is a slight increase of artificial coast in percentage terms. Still, in a monitoring period of 6 or 10 years, it amounted to a total of 50 km.
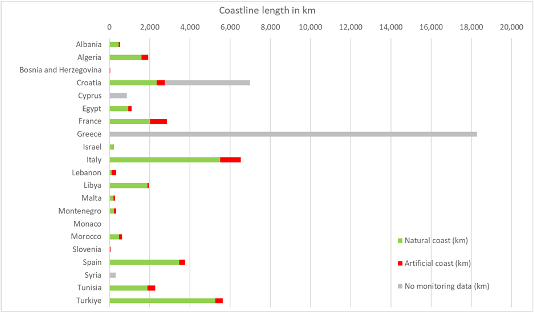
1285. Detailed baseline data at the country level is illustrated by Figure 129 . The countries that have uploaded the data to the INFO/MAP System, i.e. validated the results through an elaborated and agreed procedure of data submission are: Algeria, Bosnia and Herzegovina, France, Italy, Libya, Malta, Montenegro, Morocco, Slovenia, Spain and Türkiye (status as of 30 June 2022).
1286. As data has various reference years, scales, mapping methods and data sources one should take these into consideration before interpreting the values, particularly if comparing data among the countries. However, in terms of proportion of artificial coastline, Slovenia stands out with 75% and Lebanon with 64%, while Libya has only 4% of artificial coastline.
Figure 129: Length of natural and artificial coastline per countries in km
1287. Artificial coastline infrastructure is further mapped showing all details of the structures and described as Breakwaters, Seawaters/Revetments/Sea dike, Groins, Jetties, River mouth structures and Port and marinas. Lengths and artificial structures’ proportion of total artificial coastline are aggregated at the Mediterranean level (Table 49). Artificial structure of Ports and marinas dominates with 49% or 3 955 km.
Table 49: Artificial structures in km and in % of total artificial coastline
|
Breakwaters |
Seawalls/ Revetments/ Sea dike |
Groins |
Jetties |
River mouth structures | Port and marinas |
Unclassified |
Total |
|
| Mediterranean | 918 km | 1 625 km | 392 km | 567 km | 193 km | 3 955 km | 457 km | 8 107 km |
| coast | 11% | 20% | 5% | 7% | 2% | 49% | 6% |
There are significant differences between countries on the interpretation of the methodology when measuring the length of the artificial structures. Some countries have followed the methodology provided in the Guiding Factsheet and reported the projection of the artificial structure to the coastline. But others (such as Italy, Spain, Egypt) reported the total length of the structures.
1288. It should be emphasised that there are well-known difficulties in unambiguously defining the coastline and its length. A coastline is a geographical feature that can change significantly over time, and its length significantly depends on the level of detail with which the coastline is depicted.
Additionally, the national assessments were made for different reference years and with different mapping techniques, caused by different national data sets and geographic specifics, but also by different interpretation of instructions given in the Guidance factsheet (UNEP/MAP, 2019) and related Data Dictionaries and Data Standard (UNEP/MAP, 2019a). Thus, countries’ data cannot be completely compared. However, applying the same criteria as provided at the regional level to ensure synchronization of national efforts to set GES and threshold, and therefore, to prevent biased treatment of countries within regional assessment will allow a more objective assessment of trends once the second monitoring datasets are provided for the next QSR. The GES in the Guidance Factsheet is defined in a descriptive manner as minimised physical disturbance (negative impacts) to coastal areas induced by human activities. Future sets of monitoring data will allow more objective assessments of coastline status: whether it has been further artificialised or it has stayed within GES. This need for a systematic monitoring in Mediterranean regarding the physical disturbance of coastline due to the influence of human-made structures was also a major conclusion in the 2017 QSR.
Measures and actions to achieve GES for CI-16
1289. First, technical issues that have to be considered in future monitoring and assessments of CI 16 are as follows:
-
- Monitoring of the coastline (second and following assessments) should use the same level of details and spatial resolution as the initial assessment (baseline data). Otherwise, monitoring results could be compromised by the fact that coastline length increases by using larger scales, more so on more indented coasts.
- The calculation of the length of the coastline varies also due to deformations caused by the choice of the cartographic projection (i.e., calculated in plane by using one of the cartographic projection or by using the ellipsoid). It is recommended to use the ellipsoid lengths calculated on WGS84 as required by the Guidance Factsheet and related Data Dictionaries and Data standards.
- Methods of mapping coastline vary between the national reports which results in semantic differences of assessed CI 16, in particular with regard to mapping of the length of artificial structures. This should be taken into account while interpreting aggregate data for the Mediterranean. Classification of artificial structures should be unambiguous, regardless of the monitoring period, country or the method used (visual inspection of aerial images or field survey). A manual that will elaborate on various situations should be prepared so that interpretation is unambiguous, i.e., harmonised.
1290. Second, measures and actions to achieve GES include the following:
a. The country-specific GES should be defined based on the first set of monitoring data in order to allow assessment of changes for the next QSR. Country specificities could significantly affect the assessment, i.e., interpretation of calculated CI 16. Therefore, issues such as the following need to be taken into For example, a country with a significant length of coastline on uninhabited islands, islets and rocks and with a small proportion of artificial coast can be interpreted as a very good condition, while in fact there is a lot of construction on the mainland part of the coast. Another issue is the total length of the coastline per country. If a country has a short coastline than it is expected that the proportion of the artificial coastline will be larger to provide facilities for all human coastal and maritime activities. When defining GES thresholds, these should be considered; i.e., different thresholds could be defined for different parts of coastline. For the definition of country specific GES, the list of assessment criteria and the Guiding document prepared by PAP/RAC can be utilised (PAP/RAC, 2021), including the results of testing the Guiding document in Morocco (PAP/RAC, 2022).
1291. Also, measures and actions to achieve GES should be specified and may, in general, include the following three types:
-
- Particular management actions needed in order to move towards
- Measures aimed at obtaining new knowledge for assessing and achieving GES (e.g., scientific research, application of innovative solutions at pilot locations).
- Measures with the aim of disseminating knowledge to all stakeholders and involving them in defining measures and actions for achieving GES.
1292. Particular management actions regarding coastline artificialisation could include:
-
- Analysis of existing artificial coastlines and their categorization into those that are necessary, those that can be reduced and those that can be returned to nature (e.g., abandoned jetties, ).
- When planning new artificial structures on the coastline, first analyse whether human needs can be achieved through better management of existing artificial structures and their functional transformations.
- Along existing artificial coastlines: improve monitoring of environmental impacts and implement measures to reduce negative impacts (such as pollution, habitat fragmentation, noise, light pollution, water cycle).
- For new artificial coastlines, examine the use of nature-based solutions and ensure financial or other benefits for their implementation.
- Encouraging the use of coastline in a way that consumes spatial/natural resources as little as possible: e.g., restricting land-take for the second homes.
- Protect, restore, conserve and enhance threatened and degraded coastal habitats.
1293. Results of above measures and actions could be measured by km of reversed coastline (from artificial to natural), km of recovered coastal habitats, % of nature-based solutions used in e.g., coastal protection, number of innovative projects tested (e.g., beach nourishments without impacts on coastal habitats), number of people involved in GES awareness, number of people actively working on the measures, and alike.
Candidate CI25 Land cover change
Methodology:
The assessment of the CCI 25 Land cover change was prepared for the Adriatic sub-region. It serves as an example on how the assessment of this indicator could be prepared for the entire Mediterranean coastal region once data is available for the next QSR and once the CCI 25 is designated as a mandatory IMAP Common indicator.
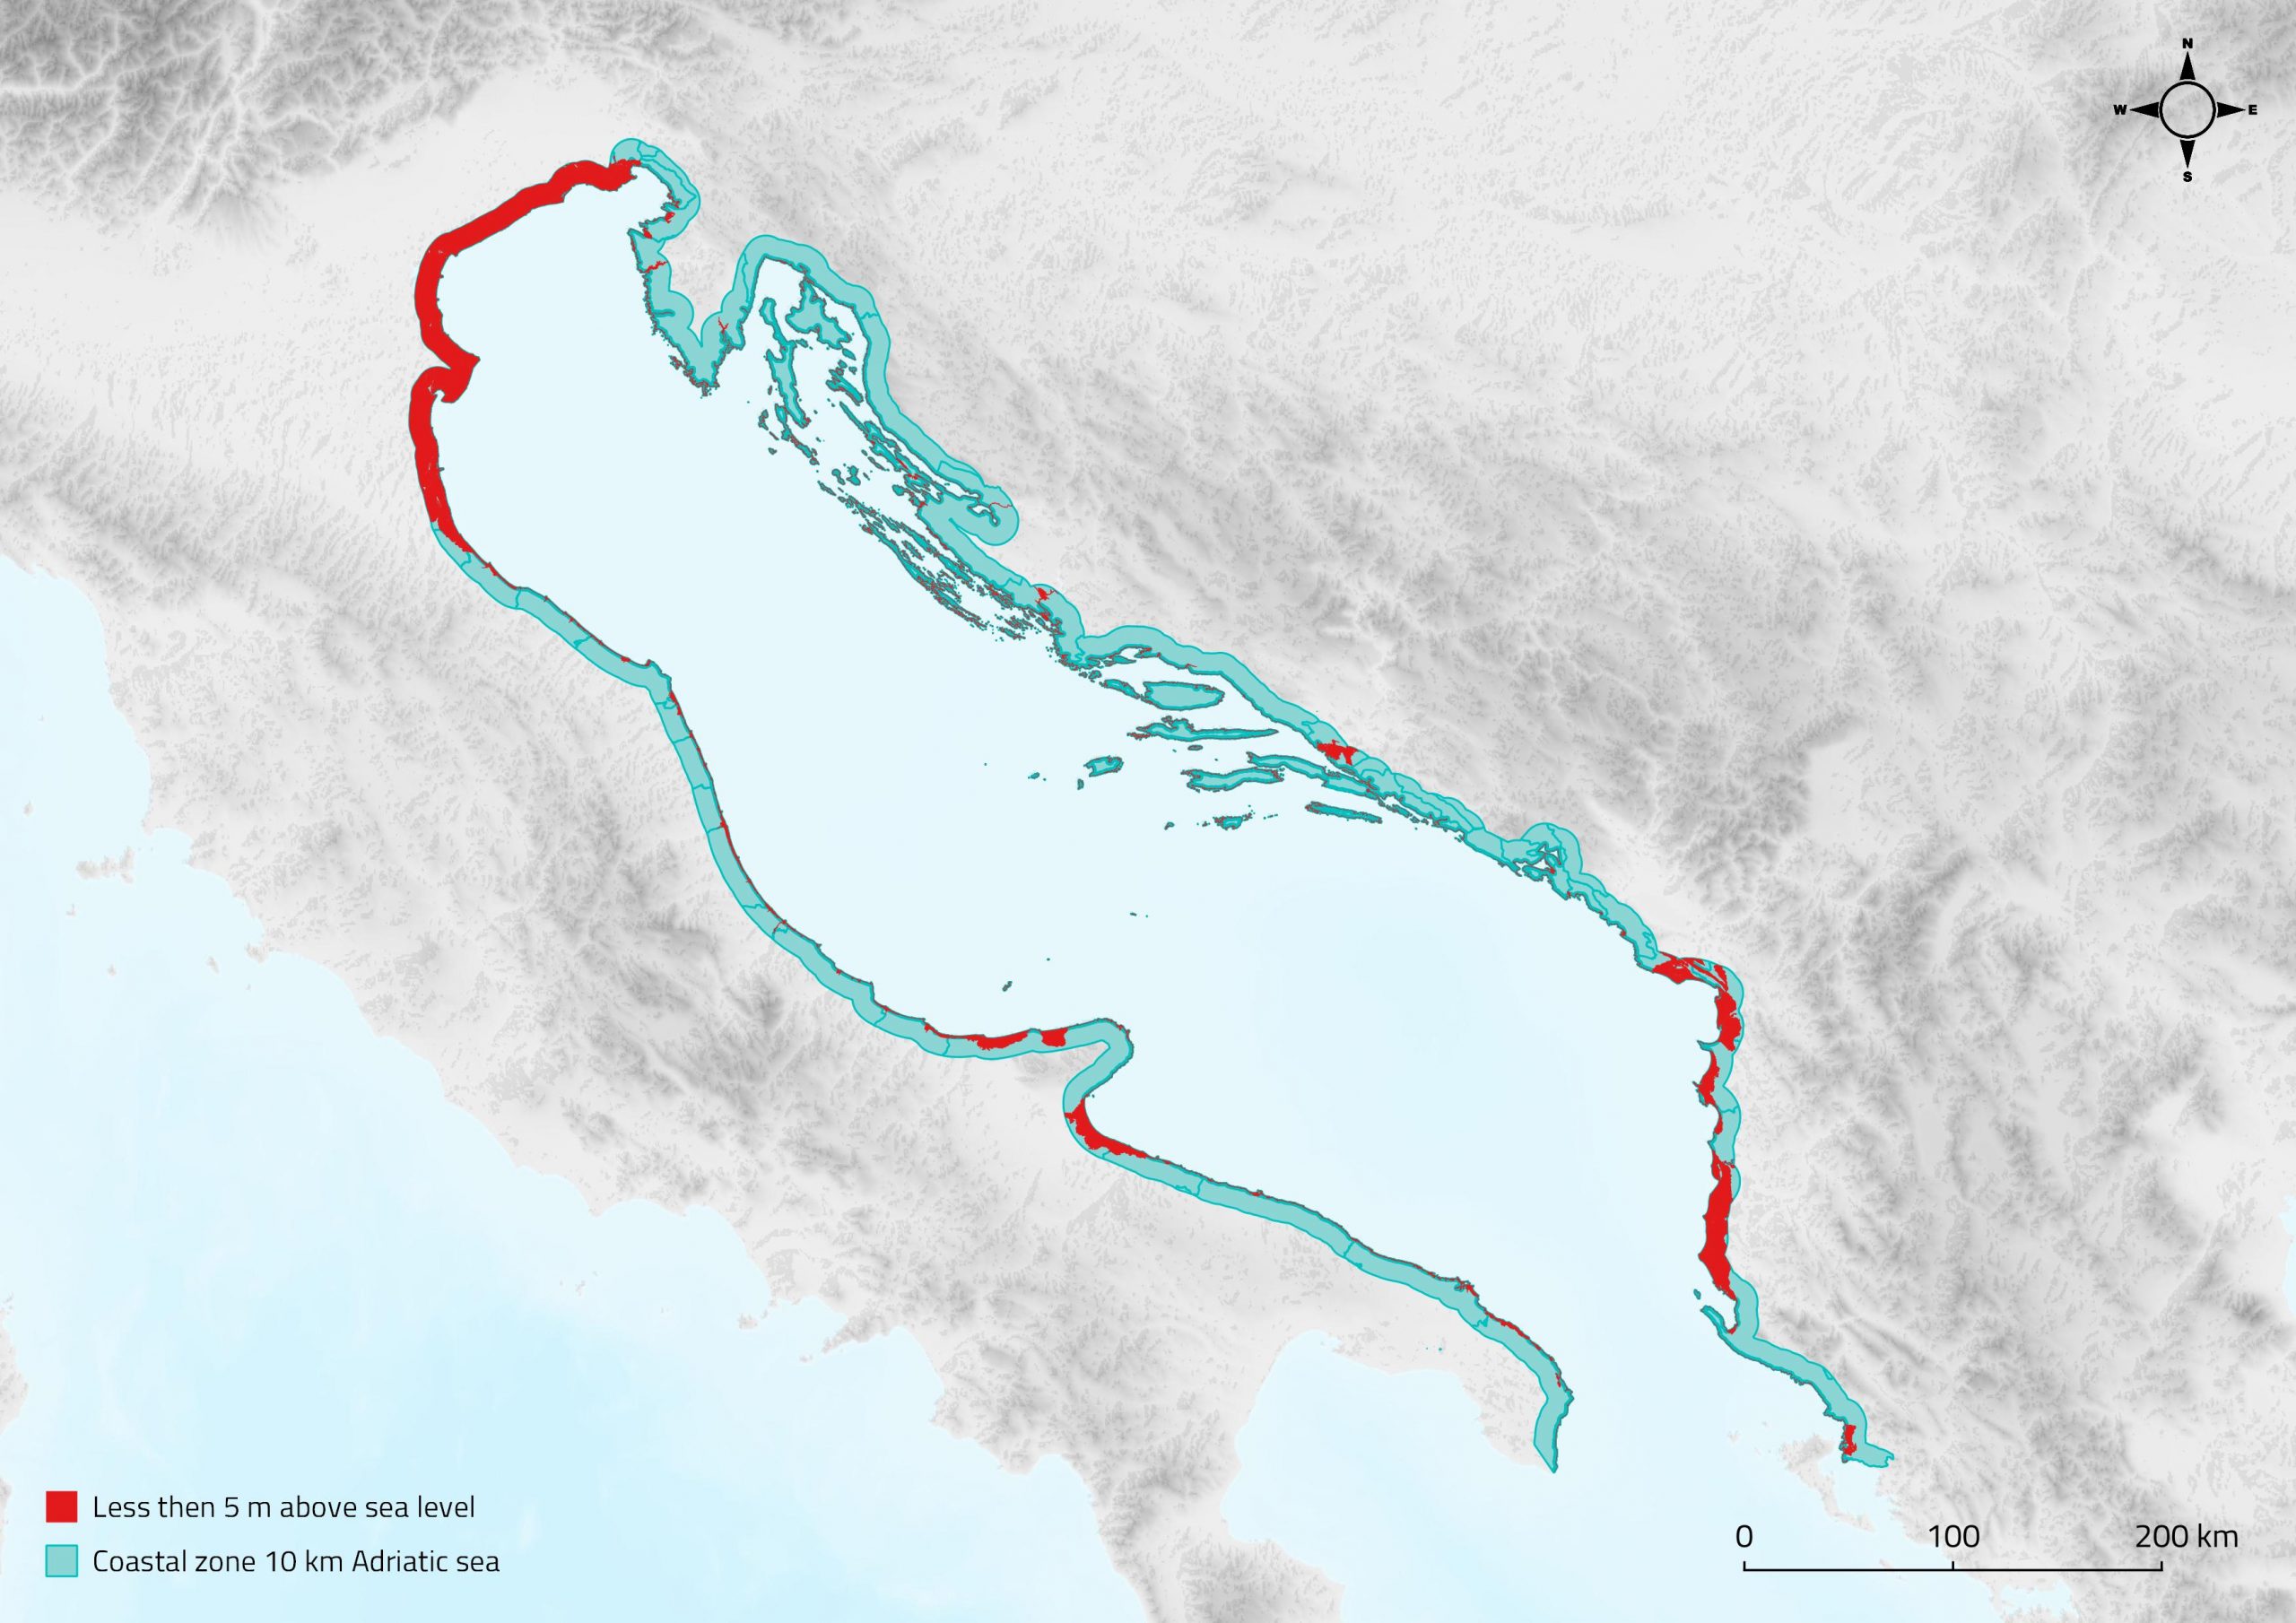
CCI 25 monitoring entails an inventory of the land cover change in the coastal zone (10 km belt from the coastline, following the practice of the European Environment Agency). The coastal zone is further divided into reporting units by coastal strips (<300 m, 300 m-1 km, 1-10 km from the coastline), Low Elevation Coastal Zone (LECZ) and coastal administrative units. The minimum mapping unit is 1 ha and 100 m for linear elements, and the minimum change detection is 1 ha. CCI 25 units for the first monitoring (i.e., establishing the baseline) are the following:
-
- km2 of built-up area in coastal zone;
- % of built-up area in coastal zone;
- % of other land cover classes in coastal zone;
- % of built-up area within coastal strips of different width compared to wider coastal units;
- % of other land cover classes within coastal strips of different width compared to wider coastal units;
- km2 of protected areas within coastal strips of different width;
- km2 of LECZ in coastal zone;
- km2 of built-up area within LECZ in coastal zone;
- % of built-up area within LECZ in coastal zone;
- % of other land cover classes within LECZ in coastal zone;
- km2 of protected areas within LECZ in coastal
For the second monitoring (i.e., assessment of change) the following units are relevant:
-
- % of increase of built-up area, or land take;
- % of change of other land cover classes;
- % of change of protected areas;
- % of increase of built-up area, or land take within LECZ;
- % of change of other land cover classes within LECZ;
- % of change of protected areas within LECZ
The Candidate CI 25 has been assessed for the Adriatic sub-region of the Mediterranean based on open-source data from the Copernicus Land Monitoring – Coastal zones service, OpenStreetMap, World Database on Protected Areas, and Forest and Buildings removed Copernicus DEM (FABDEM) global elevation map for 2012 and 2018. All data retrieved per countries from the open-sources are available here (Password: IMAP#2023). Coastal urbanisation or land take is almost an irreversible process. Therefore, the CCI 25 indicator provides, among other indications, an inventory of the urbanisation pressures on coastal ecosystems but also reveals changes between land cover classes. With an additional assessment of these processes within the Low Elevation Coastal Zone (LECZ) (Error! Reference source not found.), i.e., the zone below the elevation of 5 m above sea level, important findings related to adaptation to climate change are provided. The calculation of data and analysis has been prepared by PAP/RAC by using the above-mentioned sources, therefore countries have not provided their own assessments. The draft report (Baučić M. et al 2022 b) was discussed with the Adriatic countries at the meeting in Tunis on 10 November 2022. Upgraded with the LECZ it represents the main input to this QSR.
For the purpose of integration of CIs within EO8 the question of correlation between the CI 16 on coastline and CCI 25 on coastal land cover has been studied, particularly between the land used by human activities and related artificial coastline. Typical situations that can be observed along the Adriatic coast vary from situations with strong correlation (in front of settlement there is the artificial coast) to situations of no correlation (natural beaches in front of a settlement). It can be concluded that there is no firm correlation between land cover and the type of the coastline.
1294. Due to the candidate status of this indicator, it was not included in the 2017 Med QSR. Since then, the indicator has been tested through the implementation of several projects such as the EcAp MED II and III, the GEF MedProgramme and alike. With the active support of the CORMON meetings the Guiding Factsheet was improved and upgraded. So, it is now for the first time that this indicator is presented; however, it still at the sub-regional scale (Adriatic Sea) where data was available from the open sources and therefore, required no major contribution from the countries.
1295. Good environmental status for CCI 25 is specified in the Guidance Factsheet (UNEP/MAP, 2019) as “Linear coastal development minimised, with perpendicular development being in balance with integrity and diversity of coastal ecosystems and landscapes. Mixed land-use structure achieved in predominantly human-made coastal landscapes”.
Key messages for CCI25 (Land cover change)
1296. The assessment of CCI 25 in the Adriatic sub-region (coastal zone of 10 km width) shows the following:
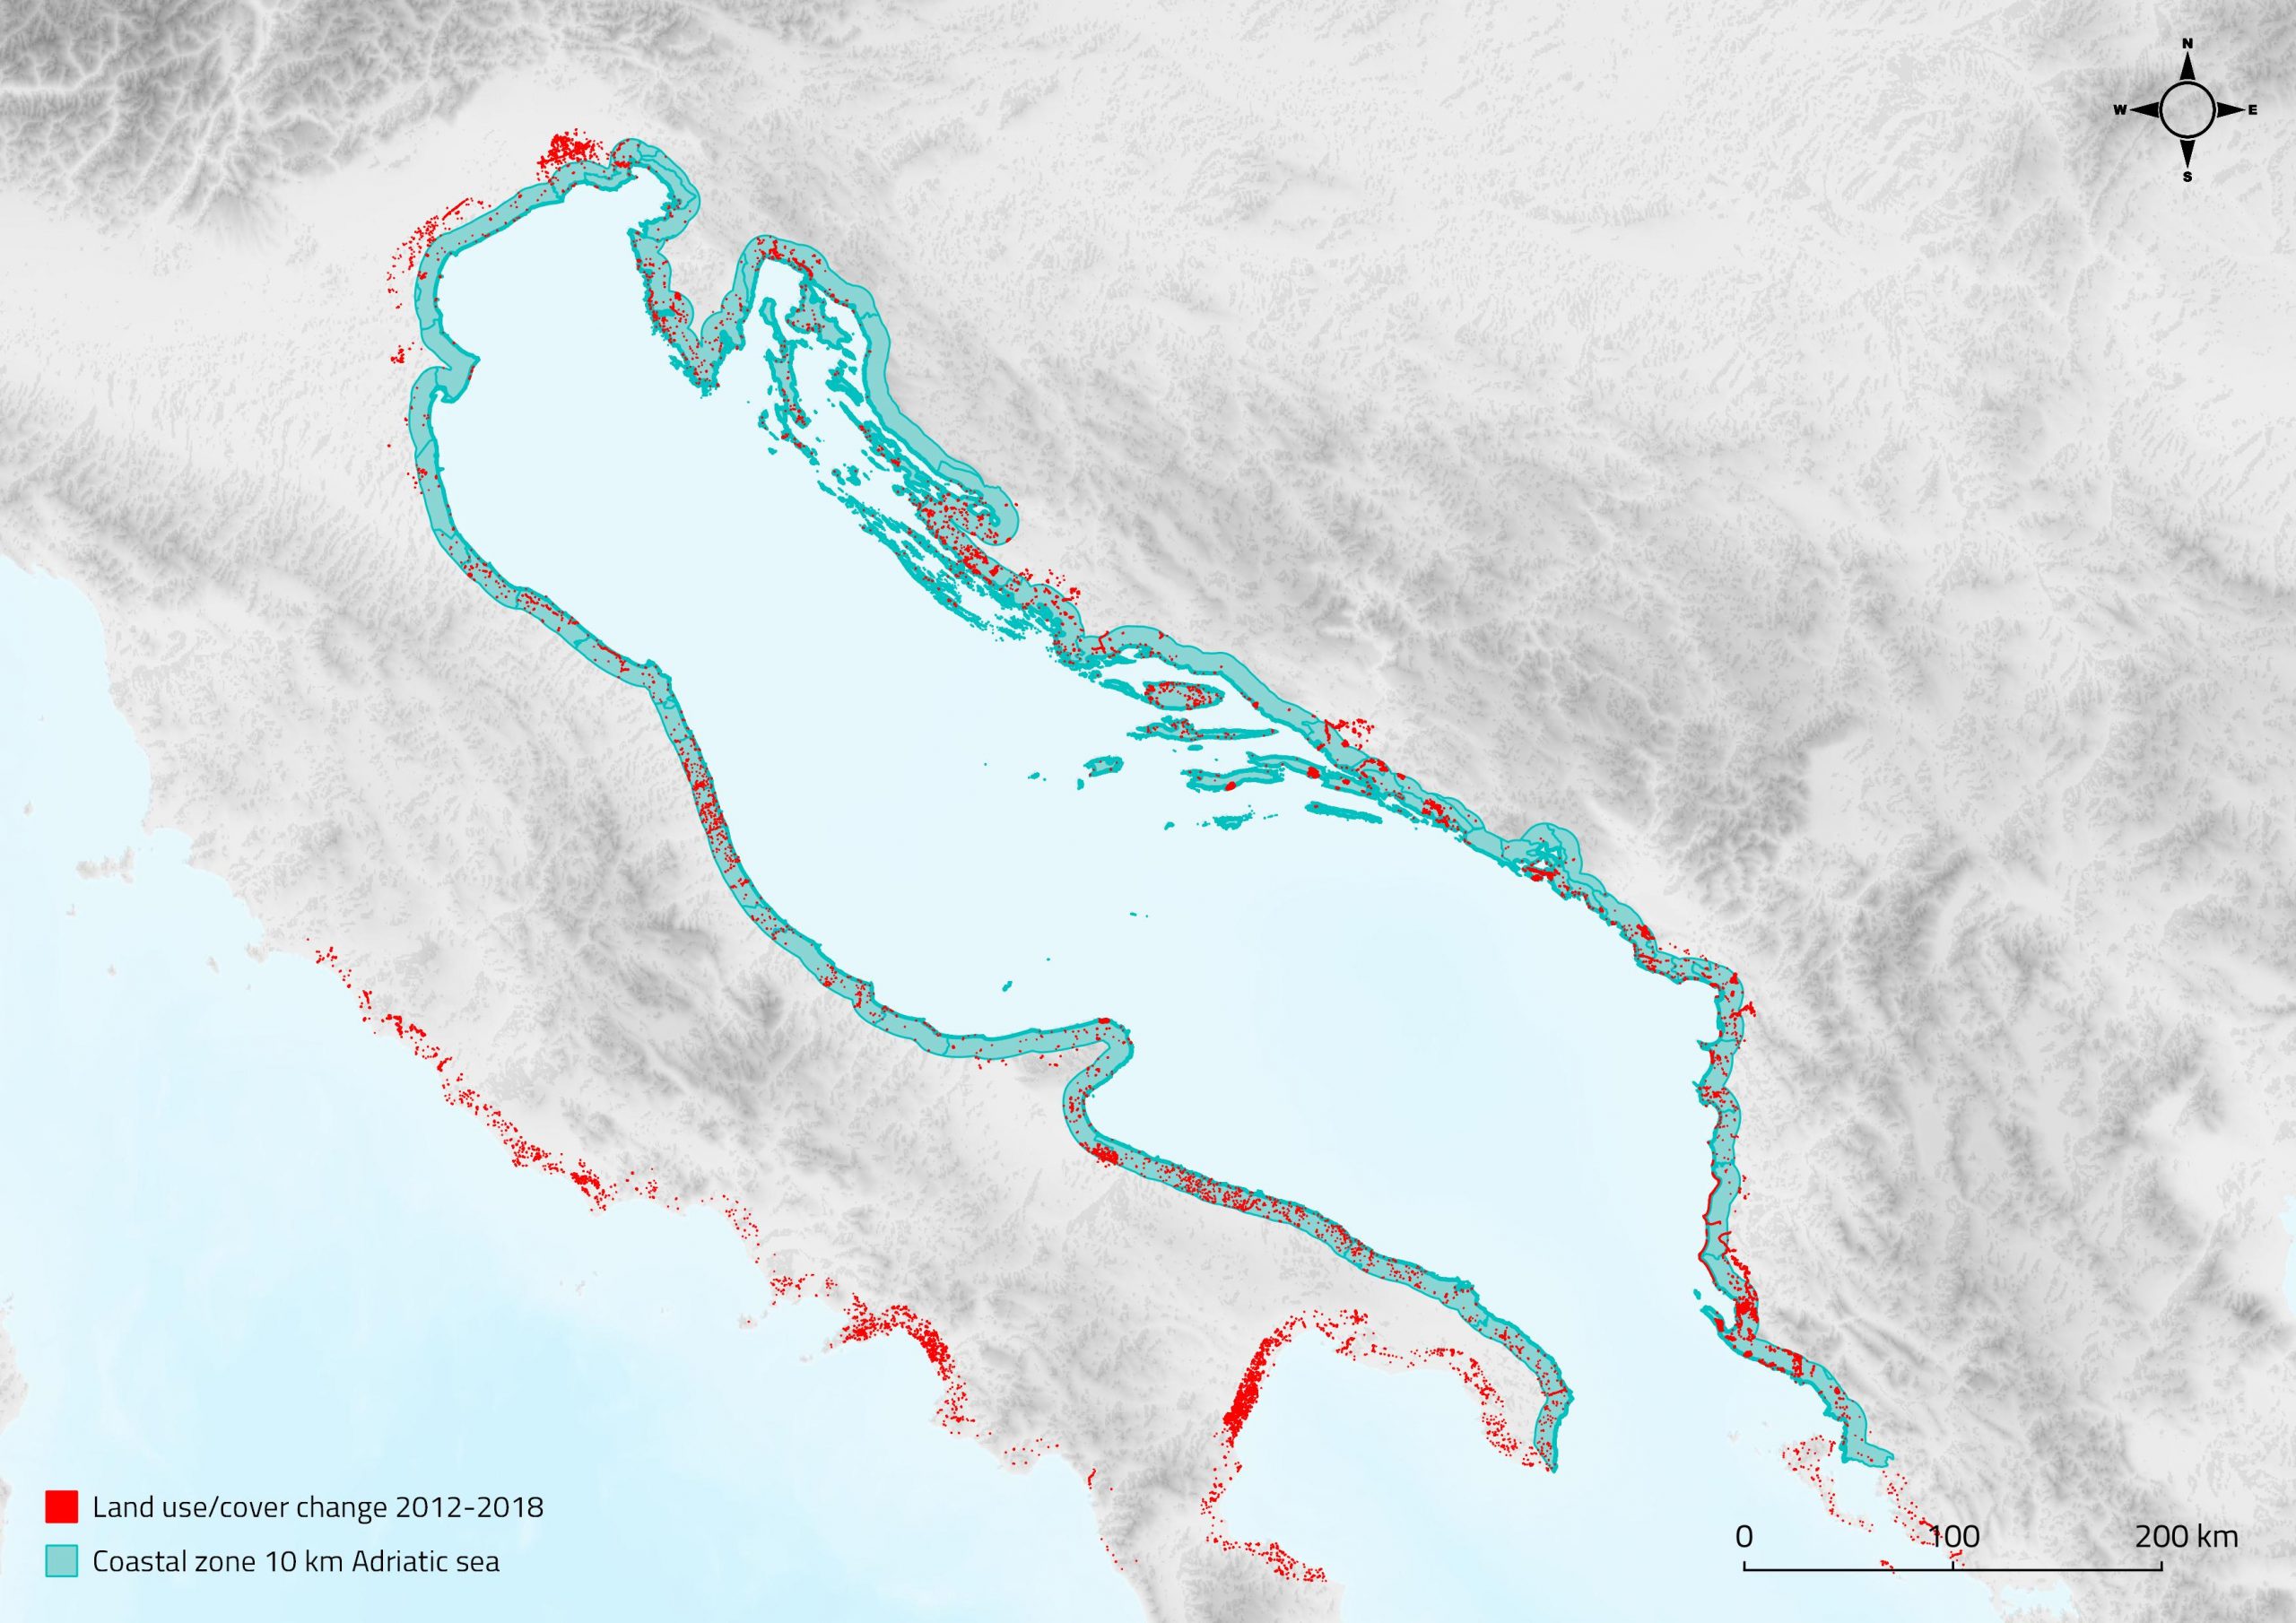
1297. In 2018 the built-up areas occupy 8.77% (2 500 km2) of the Adriatic coastal zone. The largest land cover change from 2012 is the increase of the built-up area by 27 km2 representing a land take trend of 1% in six years (Figure 130).
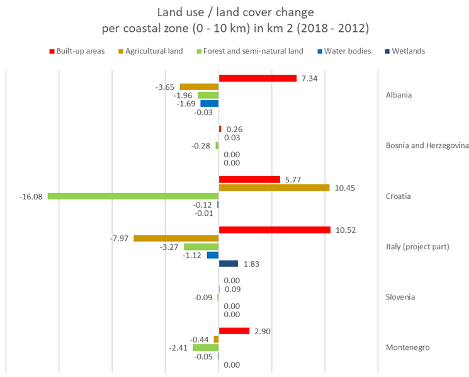
1298. In the 2012-2018 period the land cover changed from forest and semi-natural land (24 km2), water bodies (3 km2) and agricultural land (2 km2) to built-up (27 km2) and wetlands (2 km2).(Figure 131).
1299. In 2018 the narrowest coastal strip of 300 m has the highest share of built-up area (18%), more than twice as much as in the coastal zone of 10 km width. The increase in the narrowest coastal strip between 2012-2018 is 4.4 km2 while in the 300 m-1km coastal strip the increase is 3.5km2, mainly at the expense of the decrease of forests and semi-natural land, as well as water bodies and wetlands.
1300. There are no countries with a decrease of the built-up areas in the reporting period.
1301. Protected areas covered 20% in 2012, reaching 37% in 2018.
1302. The low elevation coastal zone (up to 5 m above sea level) occupies 17% (4 955 km2) of the coastal zone (10 km width), of which the built-up areas is 10% (484 km2).
Key assessment findings for CCI-25
1303. The results of the CCI 25 assessment for the Adriatic sub-region show the increasing trend of coastal urbanisation, i.e., increase of built-up areas (27km2 out of 29 km2 land cover change was land-take mostly from natural areas) On the other hand, the areas under protection have also increased showing good practice of preserving and improving GES. However, there is a slight increase of built-up areas in the protected areas. CCI 25 indicator parameters clearly identify the linear coastal development, especially pronounced in Croatia. The assessment could help countries in establishing the right measures and actions to achieve GES.
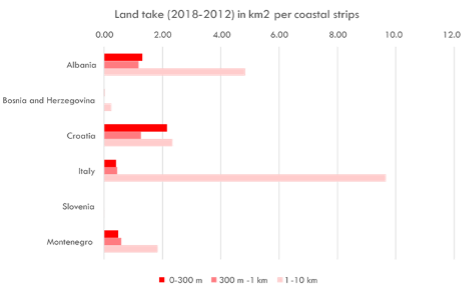
1304. Figure 133, Figure 132 illustrates land-take in km2 (increase of built-up areas) from year 2012 to 2018 per coastal strips on country level. Looking at the distribution of land-take among the coastal strips, in Croatia, followed by Albania the narrower coastal strip (by absolute area the smallest among other coastal strips), has the largest amount of land-take. This clearly identifies that urban sprawl is located at the nearest vicinity to the coastline e.g., 0-300 m and that the Article 8 of the ICZM Protocol on the setback zone should be better respected. In Albania, Italy and Montenegro, the coastal strips 1-10 km have the largest land-take meaning that majority of urban areas have not been constructed in the narrow strip along the coastline.
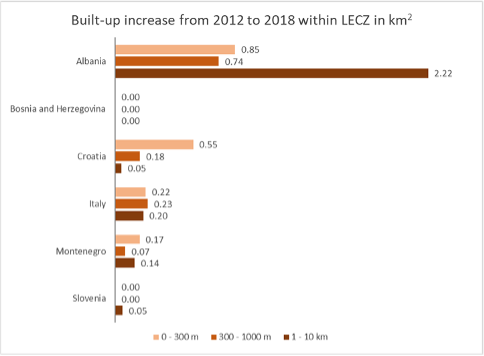
1305. The reporting unit of LECZ, i.e. areas with highest risk to be impacted by flooding, shows that large areas of coastal zones are located in the low-lying terrain and that the built-up areas continue to increase there as well. This sheds new light on the problem of coastal artificialization, which will lead to a decrease of resilience to climate change. A detailed analysis at the level of municipalities and cities could help address the problem and set new requirements for urban planning, e.g., no land-take in LECZ (Figure 132).
1306. The assessment reveals also that land cover change (2012-2018) within LECZ goes towards an increase of built-up areas in all countries within the Adriatic sub-region (increase of 6km2 that corresponds to 1% relative to built-up area in 2012). Figure 133 illustrates land-take in countries per coastal strips. Albania has the largest increase of built-up areas within LECZ and most of the land- take took place in the coastal strip 1-10 km, while in Croatia in the narrowest coast strip.
1307. A plethora of GIS data was prepared for the elaboration of this assessment report and is available to be used for other statistics and analyses, and for further GES assessment and setting up measures and actions.
1308. The methodology applied in this study confirms that the CCI 25 assessment can be made with open-source data such as OpenStreetMap, World Database on Protected Areas and Forest and Buildings removed Copernicus DEM (FABDEM) global elevation map. All these datasets are available for the whole Mediterranean. The key data for CCI 25 is land cover data, here the Copernicus Land Monitoring – Coastal zones service was used. Currently, it is not available for the entire Mediterranean. However, the best available data for the future could be the ESA World Cover Project providing global land cover maps at 10m spatial resolution, in particular if national most updated and accurate datasets are not available. As new global land cover maps are emerging monthly, having better and better spatial, thematic and temporal resolution land cover monitoring is becoming feasible for the whole Mediterranean at relatively low cost.
Measures and actions to achieve GES for CCI-25
1309. Varying geographic, socio-economic, cultural and environmental contexts of coastal zones require the application of specific measures and actions in order to achieve GES. First, in order to define GES in a more objective way a technical manual should be prepared that will allow better understanding of concepts of integrity and diversity of coastal ecosystems and landscapes and their importance for ecosystem approach. This will also allow better assessment of land cover changes in the next QSR period, in particular for the areas with significant changes.
1310. Second, more objective GES should be prepared either at the sub-regional level or at country level that will allow more objective assessments for the future QSR.
1311. The main targets under EO8 could include the following:
-
- Avoid further construction within the setback zone and the flooding prone low-lying coastal zone;
- Give priority to low-lying coastal zone when preparing adaptation plans to climate change;
- Maintain diverse and harmonised coastal land cover structure, and reverse dominance of urban land cover;
- Keep and increase landscape diversity.
1312. These general recommendations should be further elaborated and adapted to particular regions. In general, measures and action could be of the following types:
-
- Particular management actions needed in order to move towards GES;
- Measures aimed at obtaining new knowledge about assessing and achieving GES (e.g., scientific research, application of innovative solutions at pilot locations);
- Measures with the aim of disseminating knowledge to all stakeholders and involving them in the actions for achieving GES.
1313. Particular management actions regarding land cover change could include:
-
- Analysis of existing built-up areas and their categorization into those that are necessary, those that can be reduced and those that can be returned to nature (e.g., abandoned industrial zones, etc.).
- When planning new built-up areas, first analyse whether human needs can be achieved through better management of existing built-up areas and their functional transformations.
- In existing built-up areas: improve monitoring of environmental impacts and implement measures to reduce negative impacts (such pollution, habitat fragmentation, noise, light pollution, water cycle).
- For new construction areas, examine the use of nature-based solutions and ensure financial or other benefits for their implementation.
- Encouraging the use of space in a way that consumes spatial/natural resources as little as possible: e.g., restricting land-take for second homes.
- Protect, restore, conserve and enhance threatened coastal ecosystems and habitats (e.g., dunes, wetlands and coastal forests and woods, in particular).


