
2023 MED QSR WEB SITE INDEX
Ecological objectives and their related Common Indicators
E01 Biodiversity
E02 Non-indigenous species
E03 Harvest of commercially exploited fish and shellfish

E01 Biodiversity
Common Indicators 1 (Habitat distributional range) & 2 (Condition of the habitat’s typical species and communities)
885. The Mediterranean continental shelf possesses rich and important habitats. However, the anthropogenic pressure exerted on the marine and coastal habitats of the Mediterranean region led during the past decades to a substantive decrease in the extent and conditions of most of the key habitats of the region. Pollution, fisheries, urbanisation and invasive alien species (increasing temperature and UV, and acidification) are the most frequently cited pressures in the Red List of European Habitats (Gubbay et. al., 2016) affecting the distribution range and the conditions of habitats. Climate change is also affecting some mediolittoral and infralittoral habitats, especially by altering the thermal structure of the water column, with extensive mass mortalities (Rivette et al., 2014). The proliferation of coastal and marine infrastructures, such as breakwaters, ports, seawalls and offshore installations call for special concern, all being associated with loss of natural habitats and alteration of hydrographic conditions (Perkol-Finkel et al., 2012). New strategies aimed at elevating the ecological and biological value of coastal infrastructures are urgent.
886. According to available data, habitat destruction is one of the most pervasive threats to the diversity, structure, and functioning of Mediterranean marine coastal ecosystems and to the goods and services they provide.
887. The Alboran Sea, the Gulf of Lyons, the Sicily Channel and Tunisian Plateau, the Adriatic Sea, off the coasts of Egypt and Israel, along the coasts of Turkey are highly impacted. Low cumulative human impacts were found in offshore areas, and in several small coastal areas of some countries. These areas represent important opportunities for conservation aimed at preventing future degradation.
Assessment methodology for CI-1 (Habitat Distribution)
This assessment builds upon the 2017 MED QSR chapter on benthic habitats, aiming to provide a more data-driven assessment of benthic habitats across the Mediterranean Sea region, based on available datasets.
The assessment addresses both Ecological Objective 1 (benthic habitats) and Ecological Objective 6 (sea-floor integrity), following a similar approach based on Common Indicator 1 (CI-1 habitat distribution) and Common Indicator 2 (CI-2 habitat condition) of the Integrated Monitoring and Assessment Programme (IMAP).
Assessment of CI-1 and CI-2 is presented, to the extent possible, on the basis of the datasets above. For CI-2 the pressure information is used as a proxy assessment for the possible extent of impacts on habitat condition.
Narratives on the status of benthic habitats according to the sections of the QSR template are provided, drawing from recent reports, including ETC/ICM (Korpinen et al., 2019) and UNEP/MAP-SPA/RAC (2022) and from the above analyses.
The assessment of benthic habitats under EO1 and CI-1 and CI-2 is not yet well established. The approach presented here, extending to broad habitat types under EO6, aims to provide a more holistic assessment of the Mediterranean seabed and the pressures upon it, whilst acknowledging that further methodological development is needed in order to provide a full good environmental status (GES) status assessment for seabed habitats.
Key messages (Habitats):
888. The seabed and its benthic habitats are a key component of the Mediterranean’s marine ecosystem. It holds a high diversity of marine communities and species and provides a range of essential ecosystem services including provision of seafood, natural coastal protection and carbon
889. The seabed is subject to a wide range of anthropogenic pressures, arising from land-based activities which lead to pollution (contaminants, nutrient enrichment, litter) and sea-based activities that cause physical damage and loss of habitat (bottom fishing, mineral extraction, coastal and offshore infrastructure), introduce non-indigenous species, and disrupt the natural carbon cycle.
890. The seabed is under severe pressure in the coastal zone where extensive stretches of coast have lost their natural marine habitat through the building of coastal infrastructure and sea defences. Offshore, down to depths of 1000m, the most wide-spread and extensive damage to seabed habitats comes from bottom fishing using trawls and dredges. Below this depth, these fishing practices are banned, thereby providing protection to sensitive deep-sea habitats throughout the Mediterranean. However, there is increasing evidence of litter from land-based sources accumulating at these depths.
891. Particularly threatened habitats, including coralligenous habitats, maerl/rhodolith habitats and Posidonia oceanica seagrass meadows, and, are now subject to IMAP monitoring programmes under Ecological Objective (EO) 1 (biodiversity). Consideration of the wider sea-floor under EO6 (sea-floor integrity) is less well developed.
892. Given the current level of development of assessment techniques for EO1 and EO6, it is only possible to present a preliminary approach to seabed habitat assessments for the 2023 Med QSR. This is done at a broad scale and with a focus on assessing the extent of pressures, as a proxy for impacts on habitats.
893. A pilot assessment for the Adriatic Sea shows all coastal and offshore habitats are subject to multiple pressures, but habitats in the south which are below 1000m depth are less affected. The most widespread pressure is physical disturbance which, using data at a 10km-by-10km grid resolution, affects 86% of this subregion of which bottom fishing accounts for 83% of the area disturbed.
Good environmental status (GES) assessment for CI-1 (Habitat Distribution)
894. Distribution maps for the three EO1 habitats for which data are being reported under the IMAP monitoring programme are shown with IMAP data reported up to December 2022 (from Israel, Italy, Malta, Slovenia and Spain), as well as data and models from other sources:
-
- Coralligenous habitat (Figure 49, Figure 50);
- Maerl and rhodoliths habitat (Figure 51, Figure 52);
- Posidonia oceanica meadows (Figure 53, Figure 54).

Figure 49: Distribution of Coralligenous habitat in the Mediterranean Sea (from EMODnet (2021) and location of monitoring sites for Coralligenous habitat, based on data reported under IMAP up to December 2022.

Figure 50: Occurrences of Coralligenous outcrops in the Mediterranean Sea (red areas), based on literature review (from Martin et al., 2014).

Figure 51: Distribution of maerl and rhodoliths habitat in the Mediterranean Sea, based on data reported under IMAP (up to December 2022).

Figure 52: Occurrences of maerl beds in the Mediterranean Sea (red areas), based on a literature review (from Martin et al., 2014).

Figure 53: Distribution of Posidonia oceanica meadows, based on data reported under IMAP (up to December 2022) and from EMODnet (2021) (data points enlarged to enhance visibility).

Figure 54: Distribution of Posidonia oceanica meadows in the Mediterranean Sea (green areas)
(from Telesca et al., 2015).
Good environmental status (GES) assessment for CI-2 (Habitat Condition)
895. Monitoring methods have been established for three EO1 habitats and Contracting Parties have initiated data flows into the IMAP Info System. The agreed monitoring methods cover a wide range of possible techniques, yielding a variety of data The method of assessment of these data, and threshold values, are yet to be agreed under the IMAP. At present, it is therefore not feasible to assess CI-2 for EO1 habitat types. There is, however, a rich scientific literature that describes the state of these habitats and provides evidence of poor state in multiple locations across the region.
Key findings for Common Indicator CI-1 (Habitat Distribution)
896. The distributional range of broad and fine habitat types is considered to generally be in line with prevailing physiographic, geographic and climatic conditions. As the habitats are generally distributed throughout the Mediterranean (north to south, east to west), it is considered unlikely that distributional range will vary at the Mediterranean Sea scale.
897. All habitats may be subject to habitat loss; this is more pronounced in the coastal zone, due to the greater intensity of coastal infrastructures and sea defences; habitat loss is of particular concern for specific habitats under EO1. However, persistent use of bottom-contacting fishing gears can also lead to habitat loss, which may affect extensive areas on the continental shelf and slope.
898. Assessment of CI-1 requires the setting of an ‘extent threshold’ and improvement in the availability of data on habitat extent and loss. A key basis for this is the provision by Contracting Parties of improved habitat maps (both broad- and fine-scale), making these available for compilation at Mediterranean-region scale (broad habitat maps via EMODnet, other habitat types via the IMAP Info System).
Key findings for Common Indicator CI-2 (Habitat Condition)
899. Habitat condition in the Mediterranean Sea region is affected by multiple There is a greater range of pressures in the narrow coastal zone, whilst the offshore and bathyal zones, down to 1000m depth, are most affected by physical disturbance pressures.
900. Due to narrow nature of the continental shelf across much of the Mediterranean (excepting in the Adriatic Sea and the Strait of Sicily), the bathyal zone, below 1000m depth, and abyssal zone account for a very high proportion of the Mediterranean Sea. In these zones, bottom fishing is banned leading to much lower levels of physical disturbance, although the seabed may be subject to effects of contaminants accumulating in deep-sea sediments and to the accumulation of litter, such as in canyons.
901. Bottom fishing accounts for the vast majority of the physical disturbance, covering up to 90% or more of the seabed (at 10km-by-10km grid cell resolution) in coastal and offshore In some areas this may represent an overestimate of the extent of physical disturbance, due to the grid-cell resolution and use of presence/absence data.
902. Under the IMAP, Contracting Parties have started to submit data on the condition of three specified habitats for EO1; methods for interpreting these data (through specific indicators) and a setting of threshold values are needed. Data across the entire region are needed to enable an assessment of habitat condition against the GES definition for these habitat types in future QSRs.
903. For broad habitat types, improvements in the availability and resolution of pressure data, and in relating these data to the state (condition) of the habitats are This would lead to a more robust assessment than has been presented here in the pilot study.
904. Data on pressures and habitat state are generally more available in northern parts of the Mediterranean, which may incorrectly imply that these areas are in a worse state than southern areas. An effort should therefore be made to ensure an even level of data are available across the region.
Measures and Actions Required to achieve GES (CIs 1 & 2, habitats)
905. Despite many decades of scientific study on particular habitats in specific locations, systematic assessment of seabed habitats, both broad-scale and fine-scale, for the Mediterranean Sea as a whole is generally at an early stage of development. However, the knowledge base and assessment methodologies are under rapid development and offer good prospects for future QSRs.
906. Improvement in the availability of data is needed for:
-
- Habitat maps – these provide the fundamental basis for habitat assessments and need to be further improved in quality and accuracy. The EUSeaMap full coverage map of broad habitat types relies on the quality of the underlying input data, especially on seabed substrates, and needs to be improved across much of the region. Countries should be encouraged to contribute mapping data to help improve the region-wide seabed mapping;
- Activities and pressures – the mapping of pressures, using activities as a basis, provides a good means to assess the wider seabed of the region. These data are generally more easily (and cheaply) collected than direct observational data of the seabed, offering a more cost-effective means to undertake assessments. Further, such data are important for management of pressures (i.e., reducing pressures in areas to help achieved GES) and for marine spatial planning; further data collection is needed, particularly in the south and east, to provide an even coverage across the Mediterranean. The current region-wide datasets of activities and pressures (from the EEA/ETC-ICM) are at a 10km-by-10km grid resolution – for use in relation to seabed
assessments, the data need to be prepared at a finer resolution; - Monitoring data on the state of the seabed – the traditional collection of direct observations of the seabed (e.g., through video and sampling) remains an important aspect of data collection programmes, providing a means to validate pressure data to assess seabed habitat condition. Monitoring programmes are costly and need to be focused on the needs of assessment and measures to ensure good To facilitate pan-regional assessments, the monitoring data need to be compatible between countries, following specified data standards; further data collection is needed, particularly in the south and east, to provide an even coverage across the Mediterranean;
- Pressure-state interactions – there is continued need for study of pressure-state interactions, both at research level and through state assessments, to improve confidence in use of pressure data (such as a proxy for broad-scale state assessments);
- Climate change – the effects of climate change on the seabed and its communities need to be better understood; of particular importance is assessment of the carbon storage capacity of marine habitats and the contribution this makes to mitigation of climate change effects; the importance of shallow vegetated habitats, such as Posidonia oceanica meadows, for blue carbon is often highlighted, but the carbon sequestration capacity of the much more extensive soft sediment habitats of the shelf zone and its disruption by physical disturbance pressures is ultimately a more important knowledge gap;
- Assessment methods – further work is needed to develop specific indicators (or test existing indicators available in other regions) for use with the monitoring data, and to bring the assessment methods to a fully operational level. Based on these methods, Contracting Parties need to agree threshold values to provide a clear means to assess the extent to which GES has been achieved;
- Assessment results – the availability of seabed assessment results, including visualisation of the extent of GES in each part of the region, provides an important output that demonstrates the work of the IMAP and Contracting Parties, stimulates improvements and helps direct actions towards achieving GES.
Common Indicators 3, 4 and 5 (Bird species)
907. Seabirds as a group occur in all seas and oceans In the Mediterranean, similar to other taxonomic groups, the endemism rate for seabirds is high with various endemic or near- endemic taxa at a species or subspecies level. In addition to their ecological importance, the role of seabirds as potential indicators of marine conditions is widely acknowledged.
908. Nevertheless, despite the importance of seabirds, the most important current challenge is to ensure the survival and improve the status of the many seabird species which are already globally threatened with extinction and to maintain the remainder in favourable conservation status. Indeed, seabirds are among the most threatened bird groups They are all endangered by a number of threats, including contamination by oil pollutants, direct and indirect depletion of food resources, non- sustainable forms of tourism, disturbance, direct persecution including illegal hunting and the use of poison, mortality from bycatch, wind farms, loss of habitats, degradation of habitat, introduction of and predation by alien species as well as climate change.
Assessment methodology for CI3-CI5 of EO1 regarding seabirds
For the current assessment, the reporting and processing is not yet carried out through the IMAP Info System. Thus, for CI3-CI5 of EO1 regarding seabirds, the assessment for the 2023 MED QSR is mainly based on national monitoring datasets, submitted to SPA/RAC by the CPs’ focal points. Datasets for at least some of the Common Indicators and some of the 11 indicator species have been received from a list of CPs. Datasets provided by the CPs’ focal points were complemented with data from additional sources where available. The following additional data sources were utilised:
- Wetland International – International Winter Census (IWC) data: Datasets of IWC midwinter counts collected during the current assessment cycle were requested from Wetland International for all CPs.
- Birdlife International – Seabird Tracking Database: Datasets of tracked individuals of indicator species in the region were requested from BirdLife International
- Experts on indicator species in the region: Additional information was received from experts of specific indicator
- Published reports on the topic containing relevant information and data concerning the current assessment cycle for specific countries, subregions, or the entire region.
Where available, GES assessments were adopted from national assessments carried out by the CPs. Otherwise, where data quality permitted, evidence-based GES assessments are carried out using quantitative monitoring data collected by each CP during the current assessment cycle. Only if/where it is believed that data collected by the CPs are not sufficient (based on data quality, methodologies used and/or representativeness), quantitative monitoring data collected by other entities were added for the GES assessment. Data is integrated for the GES assessment, creating the basis of the 2023 MED QSR.
For each CI, indicator species, and CP (and stage were relevant, e.g., breeding versus non- breeding), GES is assessed separately, using the methodologies outlined in the document “Monitoring and Assessment Scales, Assessment Criteria, Thresholds and Baseline Values for the IMAP Common Indicators 3, 4 and 5 related to sea birds” (UNEP/MED WG.521/Inf.7). GES is presented in a simplified traffic-light system approach (see Tables 13-17). Data from complete assessments or from sub-samples that are deemed representative are evaluated against baselines (in most cases: modern baselines collected in previous assessment cycles) using threshold values.
Key Messages (Bird species)
909. Within the Ecological Objective EO1 seabirds sensu lato form a crucial component of the region’s marine biodiversity and ecosystem with many of the relevant taxa being endemic or near endemic in the Mediterranean. Mostly situated on top of marine food webs, these highly mobile organisms come to land to breed, thus contributing to nutrient exchange between marine and coastal areas, by linking sea and land.
910. Facing multiple pressures at land and at sea, seabirds from different functional ecological groups in the region act as indicators and serve as sentinels for the health of the Mediterranean Ecosystem.
911. The integrated Good Environmental Status (GES) of EO1 of three Common Indicators related to seabirds (CI3-CI5) reveals that for many populations of various species GES is reached, when taking a modern baseline approach. However, the data quality currently prevents a truly quantitative integrated GES assessment across the entire region. Furthermore, specifically some of the endemic taxa which are of conservation concern, currently appear to fail to reach GES targets, at least in some of the CIs.
912. Closing data gaps, harmonising data collection and monitoring programs and further implementing conservation actions within the Marine Protected Areas (MPA) network that are providing promising results, are important steps for successfully assessing GES and reaching set targets across the region in the near future.
Good environmental status (GES) / alternative assessment (CIs 3, 4 and 5 for Bird species)
913. Based on the monitoring data received at the country level for focal species, GES assessment was carried out for a total of 11 species from six functional groups, for three CIs and four subregions. The detailed results of species, CI and subregion-based analysis are given in the following subsections and a summary of these results are provided in Table 28 to
914. Table 32.
915. The eleven species considered for the assessment are:
-
-
- Osprey Pandion haliaetus
- Kentish Plover Charadrius alexandrines
- Mediterranean Shag Gulosus aristotelis desmarestii
- Audouin’s Gull Ichthyaetus audouinii
- Slender-billed Gull Chroicocephalus genei
- Lesser-crested Tern Thalasseus bengalensis emigrates
- Sandwich Tern Thalasseus sandvicensis
- Mediterranean Storm-petrel Hydrobates pelagicus melitensis
- Scopoli’s Shearwater Calonectris Diomedea
- Yelkouan Shearwater Puffinus yelkouan
- Balearic Shearwater Puffinus mauretanicus
-
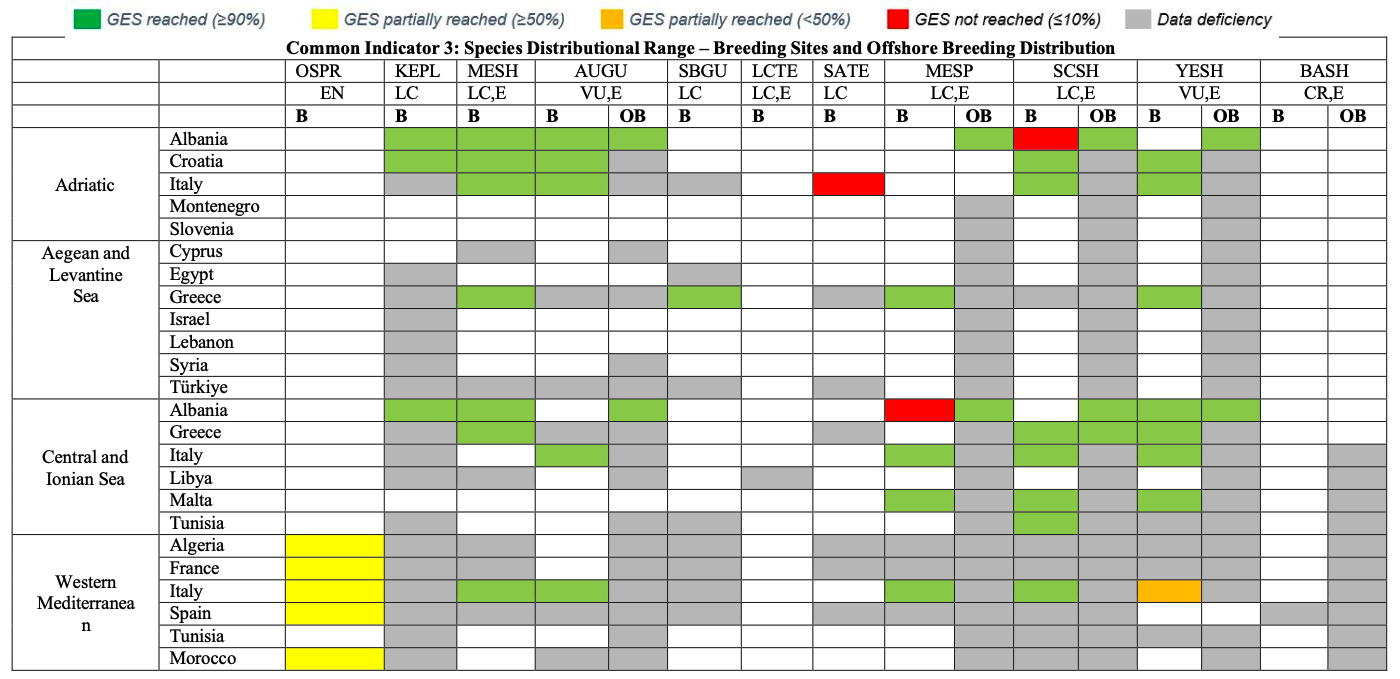
Table 28
GES Assessment for CI3. OSPR: Osprey, KEPL: Kentish Plover, MESH: Mediterranean Shag, AUGU: Audouin’s Gull, SBGU: Slender-billed Gull, LCTE: Lesser Crested Tern, SATE: Sandwich Tern, MESP: Mediterranean Storm-petrel, SCSH: Scopoli’s Shearwater, YESH: Yelkouan Shearwater, BASH: Balearic Shearwater. B: Breeding, OB: Offshore Breeding. LC: Least Concern, VU: Vulnerable, EN: Endangered, CR: Critically Endangered, E: Endemic or near endemic
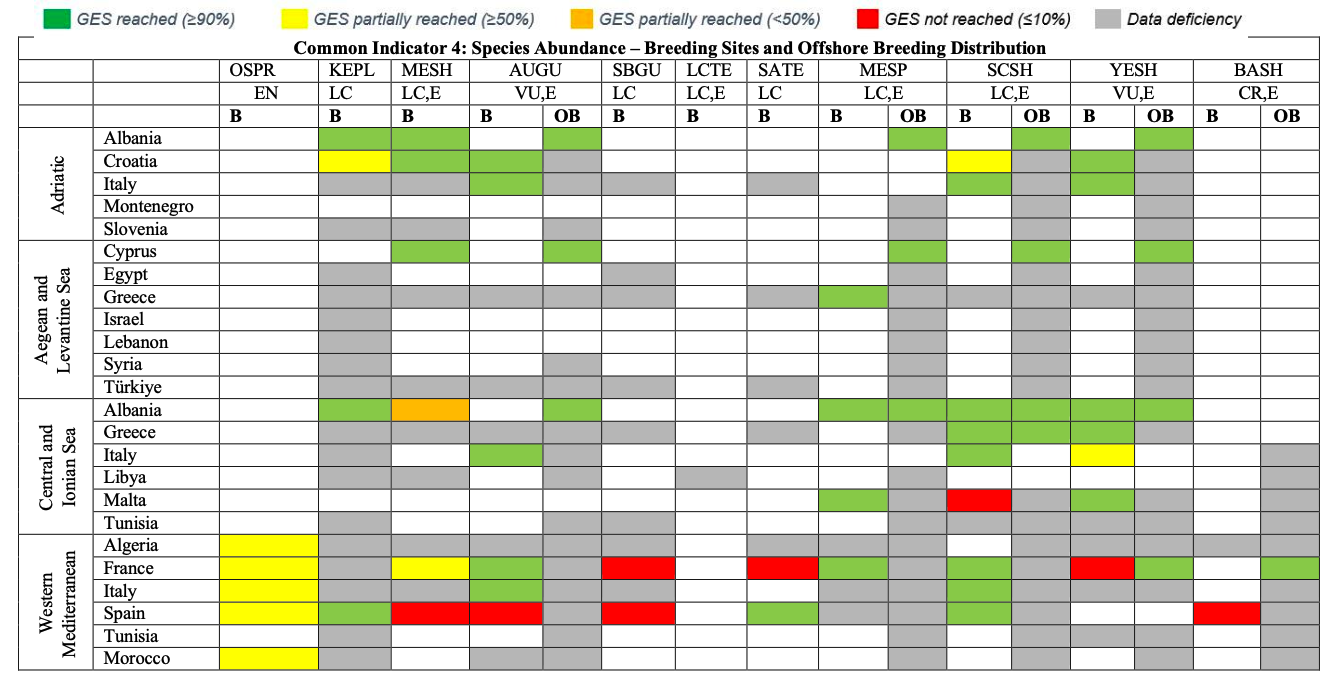
Table 29
GES Assessment for CI4. OSPR: Osprey, KEPL: Kentish Plover, MESH: Mediterranean Shag, AUGU: Audouin’s Gull, SBGU: Slender-billed Gull, LCTE: Lesser Crested Tern, SATE: Sandwich Tern, MESP: Mediterranean Storm-petrel, SCSH: Scopoli’s Shearwater, YESH: Yelkouan Shearwater, BASH: Balearic Shearwater. B: Breeding, OB: Offshore Breeding. LC: Least Concern, VU: Vulnerable, CR: Critically Endangered, E: Endemic or near endemic
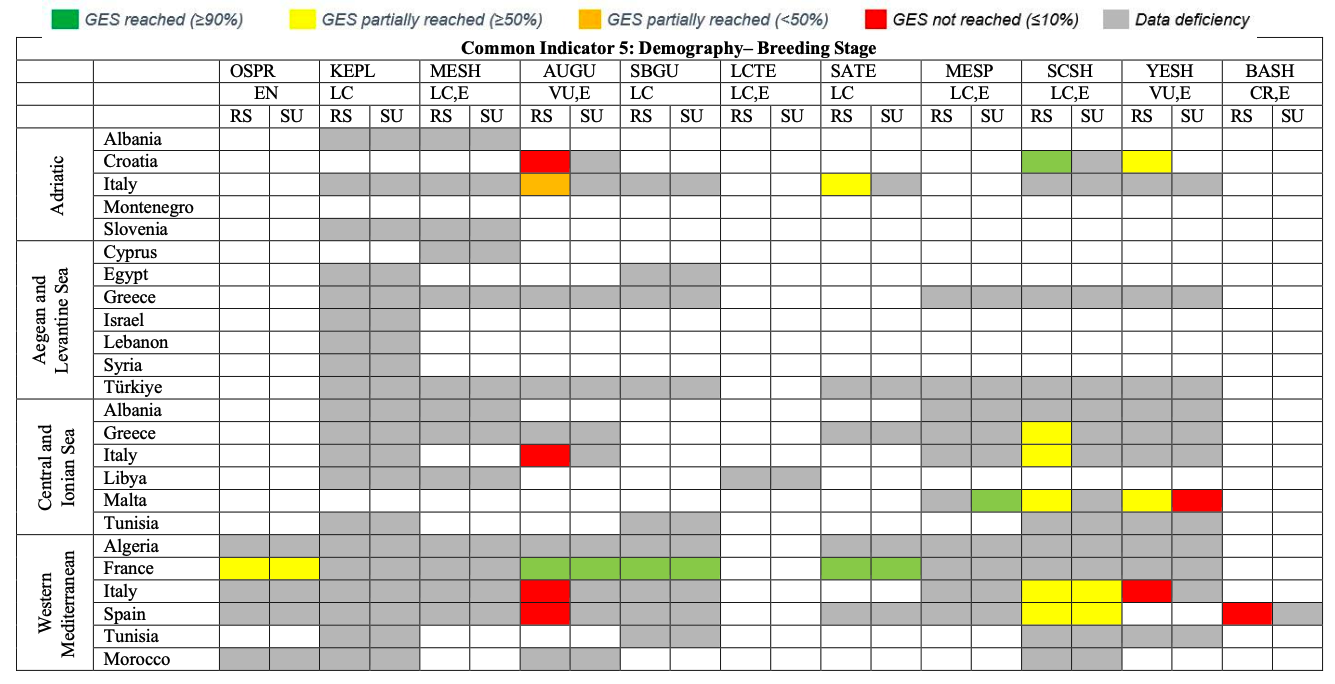
Table 30
GES Assessment for CI5. OSPR: Osprey, KEPL: Kentish Plover, MESH: Mediterranean Shag, AUGU: Audouin’s Gull, SBGU: Slender-billed Gull, LCTE: Lesser Crested Tern, SATE: Sandwich Tern, MESP: Mediterranean Storm-petrel, SCSH: Scopoli’s Shearwater, YESH: Yelkouan Shearwater, BASH: Balearic Shearwater. RS: Reproductive Success, SU: Survival Rate. LC: Least Concern, VU: Vulnerable, CR: Critically Endangered, E: Endemic or near endemic
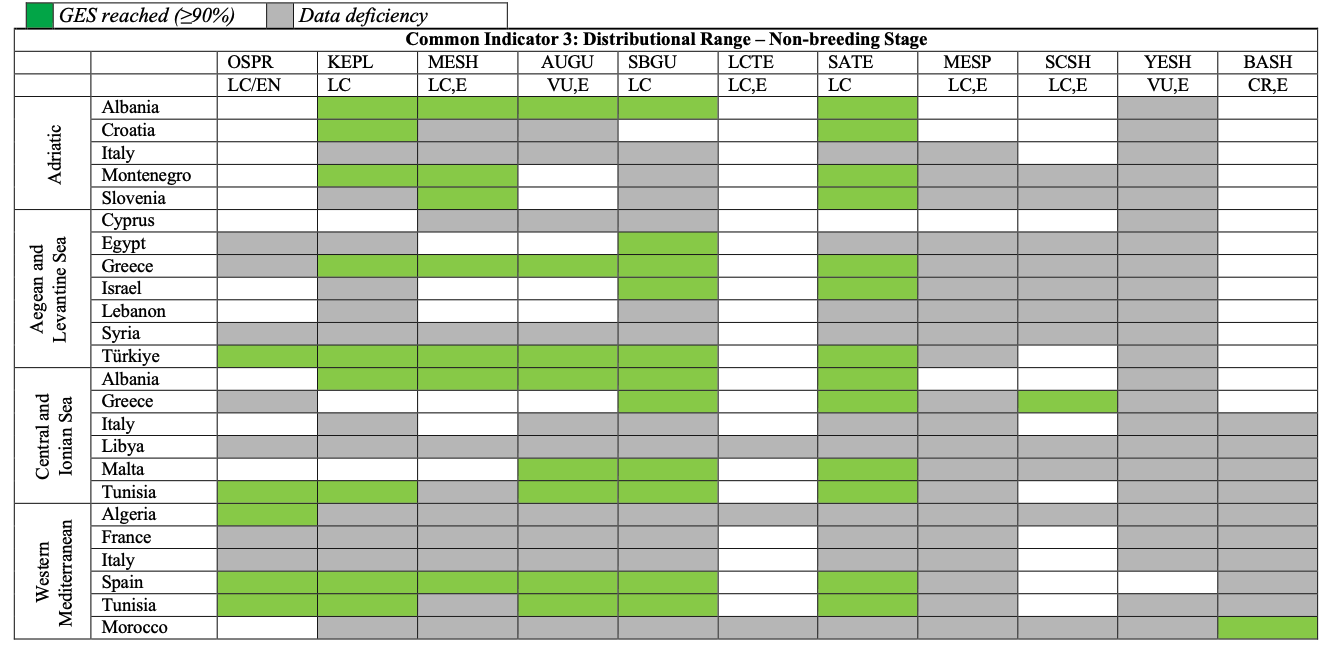
Table 31
GES Assessment for CI3 non-breeding state. OSPR: Osprey, KEPL: Kentish Plover, MESH: Mediterranean Shag, AUGU: Audouin’s Gull, SBGU: Slender-billed Gull, LCTE: Lesser Crested Tern, SATE: Sandwich Tern, MESP: Mediterranean Storm-petrel, SCSH: Scopoli’s Shearwater, YESH: Yelkouan Shearwater, BASH: Balearic Shearwater. LC: Least Concern, VU: Vulnerable, CR: Critically Endangered, E: Endemic or near endemic
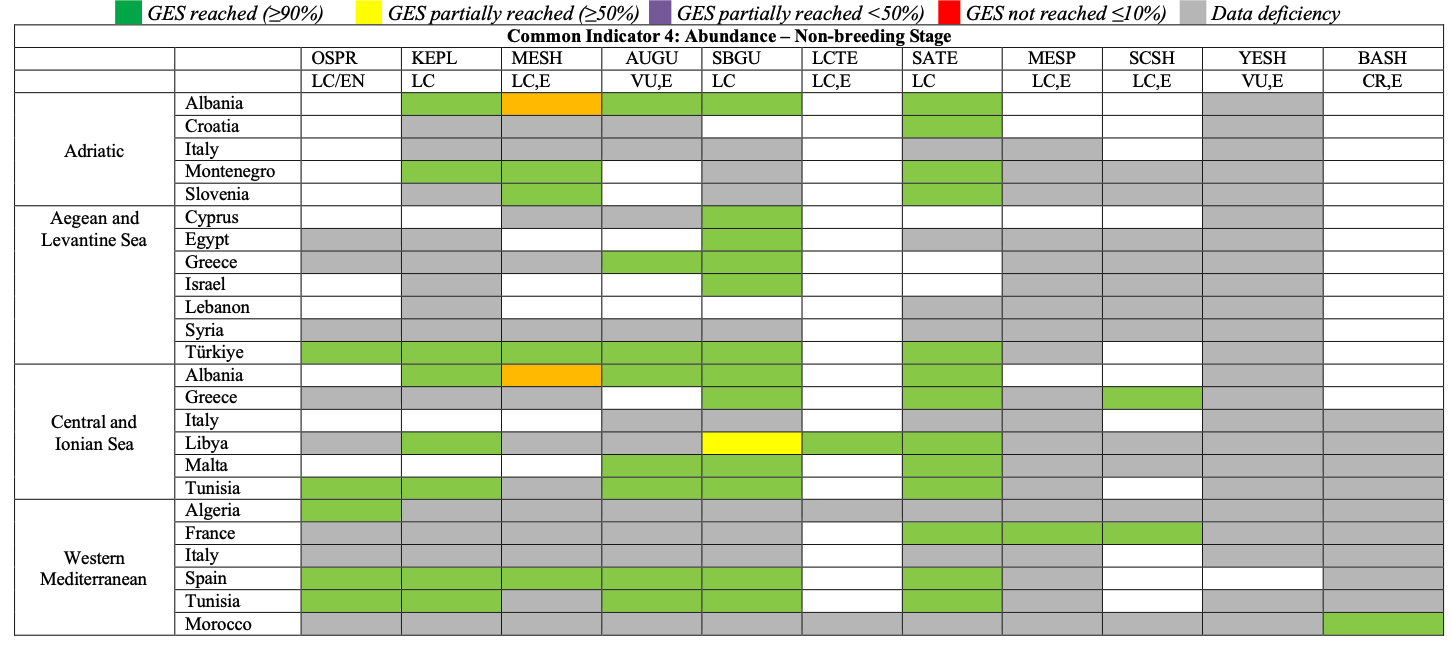
Table 32
GES Assessment for CI4, non-breeding stage. OSPR: Osprey, KEPL: Kentish Plover, MESH: Mediterranean Shag, AUGU: Audouin’s Gull, SBGU: Slender-billed Gull, LCTE: Lesser Crested Tern, SATE: Sandwich Tern, MESP: Mediterranean Storm-petrel, SCSH: Scopoli’s Shearwater, YESH: Yelkouan Shearwater, BASH: Balearic Shearwater. LC: Least Concern, VU: Vulnerable, CR: Critically Endangered, E: Endemic or near endemic
Osprey Pandion haliaetus
916. With a close to global distribution range, the Osprey is currently listed as Least Concern by the IUCN with an overall increasing population trend (Birdlife International 2023). However, a regional assessment of breeding raptors across the Mediterranean lists the species as Endangered (Westrip et al. 2022). The status of the Mediterranean Breeding population is used as a reference for the current assessment.
917. The main pressures on the species are believed to be disturbance and loss of nesting habitats due to development and direct persecution (illegal killing). Pollutants and electrocution in powerlines are additional pressures.
Common Indicator 3: Species Distribution Range (Osprey Pandion haliaetus)
918. The breeding distribution in the region is restricted to the Western Mediterranean subregion, where the species currently breeds in the CPs Algeria, France (Corsica), Italy, Morocco and Spain (Balearic Islands).
919. The distribution range of the breeding population is assessed as stable (well within the 10% threshold). However, for the species to recover from the current status in the region, an increase in range would be required. Therefore GES is currently not reached. There is no indication for a range shift since the last assessment cycle.
Common Indicator 4: Population abundance of selected species (Osprey Pandion haliaetus)
Common Indicator 5: Population Demographic Characteristics (Osprey Pandion haliaetus)
922. Adult survival and reproductive success rates of the breeding population in the Western Mediterranean Subregion are utilised to assess GES of CI In France, the annual survival rate has been identified to be at 0.52. The annual reproductive success rate is given as 0.62 for Italy and as 0.72 for France with a baseline of 1.17 given for the latter one (1987-1988). Both adult survival and reproductive success rate appear relatively low. Demographic parameters for Ospreys were not available from other CPs, which will ideally be collected during future assessment cycles to identify if CI 5 reaches GES in the Western Mediterranean.
Kentish Plover Charadrius alexandrines
923. CPs holding breeding populations in the Mediterranean are Albania, Algeria, Croatia, Cyprus, Egypt, France, Greece, Israel, Italy, Lebanon, Libya, Morocco, Slovenia, Spain, Tunisia and Türkiye. Due to its large distribution range, the species is globally listed as Least Concern by the IUCN (Birdlife International 2023). However, the population trend is believed to be decreasing both globally and in the region.
924. Main pressures acting on the species in the region are the loss and degradation of coastal habitats, estuaries and wetlands due to intensive developments, disturbance from recreational and economic activities during breeding and problematic species such as feral dogs, crows, foxes and large gulls.
Common Indicator 3: Species Distributional Range (Kentish Plover Charadrius alexandrinus)
925. The species distributional range during the current assessment cycle is available for the CPs Albania and Croatia (subregion Adriatic). It is assessed against a modern baseline as being stable (Albania) to increasing (Croatia).
Common Indicator 4: Population abundance (Kentish Plover Charadrius alexandrinus)
926. Data on breeding pairs have been provided by Albania, Croatia and Spain. The relative breeding bird abundance is assessed as 1.0 for Albania (361-645bps) and as 0.9-1.0 for Croatia (27- 32bps), taking a modern baseline approach. These values indicate that GES is reached locally. The relative breeding population abundance for the Spanish part of the Western Mediterranean is assessed as 26, therefore not reaching GES locally. For a successful GES assessment of the species regarding CI 4 in the entire region, CPs would need to provide baseline and current values on the number of breeding pairs.
927. Kentish Plovers are reported to winter regularly in all subregions as revealed by IWC midwinter count IWC count data during the current assessment cycle amount to approximately 11.000 individuals wintering annually in the region. To confirm that GES regarding the wintering population is reached, CPs would need to provide baseline values for the Kentish plover wintering populations.
Common Indicator 5: Population Demographic Characteristics (Kentish Plover Charadrius alexandrinus)
928. No CP provided data on reproductive success and annual survival rates of Kentish Plovers in the region, thus GES regarding CI 5 could not be assessed.
Mediterranean Shag Gulosus aristotelis desmarestii
929. The Mediterranean Shag is a subspecies of the European Shag. It is endemic to the Mediterranean and Black CPs with breeding populations include Albania, Algeria, Croatia, Cyprus, Egypt, France, Greece, Italy, Libya, Morocco, Spain, Tunisia, and Türkiye. The European Shag is listed as Least Concern by the IUCN (Birdlife International 2023), but with decreasing population numbers.
Common Indicator 3: Species Distributional Range (Mediterranean Shag Gulosus aristotelis desmarestii )
Common Indicator 4: Population abundance (Mediterranean Shag Gulosus aristotelis desmarestii )
931. The assessment and monitoring of this indicator is mainly aiming at the breeding population of the species in the region. Data on the number of breeding pairs against a modern baseline have been provided by Albania and Croatia (Adriatic subregion) and by Cyprus (Aegean- Levantine Sea), all with stable population abundance (relative population abundance ~ 0). The at-sea population abundance of the species in Cyprus is assessed as stable.
932. Data from the Western Mediterranean subregion have been provided by France and Spain, both showing a decline in population abundance as compared to the baseline. The relative population abundance of the French population was assessed at 0.8, still above the defined threshold value.
However, the relative population abundance of the Spanish population was assessed at 0.31, well below the threshold value (>0.7). Therefore, it appears likely that the GES in the entire Western Mediterranean subregion is currently not reached.
Common Indicator 5: Population Demographic Characteristics (Mediterranean Shag Gulosus aristotelis desmarestii )
933. No CP provided data on reproductive success and annual survival rates of Mediterranean Shags in the region. Greece provided baseline levels for hatching and fledgling success. Overall GES regarding CI 5 could not be assessed.
Audouin’s Gull Ichthyaetus audouinii
934. Part of the functional ecological group Offshore surface-feeders, the Audouin’s Gull is near endemic in the region, with approximately 90% of the 33000-46000 mature individuals breeding in the Mediterranean. CPs with breeding populations include Spain, France, Morocco, Algeria, Tunisia, Italy, Croatia, Greece, Cyprus and Türkiye. Due to a recent population decline the species is currently listed as Vulnerable by the IUCN (Birdlife International 2023).
935. It is a widely marine gull species, foraging mainly on fish including fisheries discards. Audouin’s Gulls nest in colonies on rocky cliffs, offshore islands and islets, saltmarshes, and sandy peninsulas. Audouin’s Gulls lay three to four eggs per season.
Common Indicator 3: Species Distributional Range (Audouin’s Gull Ichthyaetus audouinii )
936. Assessments of breeding distributional range against a modern baseline were provided by the CPs Albania, Croatia and Italy where the relative area of occupancy was assessed as stable (1.0, Albania, Croatia) or increasing (1.2, Italy). Baseline data for the species distributional range have been provided by Greece.
937. To assess GES of CI 3 of the species for all subregions, other CPs with breeding populations would need to provide current and baseline data of distributional range across the region.
Common Indicator 4: Population abundance of selected species (Audouin’s Gull Ichthyaetus audouinii )
938. The assessment of CI 4 is based on the breeding and non-breeding population of the species. Current numbers of breeding pairs and baseline levels have been provided by the CPs Croatia, France, Italy and Spain. The breeding population abundance has been assessed as increasing in parts of the relatively small Adriatic population (relative breeding abundance 1.9 – 13). It has also been assessed as increasing for parts of the population of the Central and Ionian Sea (relative breeding abundance: 2.8). In the Western Mediterranean, the breeding population abundance in colonies of birds from Spain, which account for approximately 80% of the global population, has been decreasing (overall relative breeding abundance: 0.54). The smaller populations in the Western Mediterranean subregion in Italy and France have been assessed as stable for Italy (0.9) and increasing for France (1.5). While GES of this CI is assumed to be reached for Audouin’s Gulls of the Adriatic and Central and Ionian Sea, no data was available for the Aegean and Levantine Sea. However, baseline data from the Aegean and Levantine Sea have been provided by Greece, where the species has declined during the previous assessment cycle. It is expected that GES is not reached in the Greek part of this subregion. On the basis of data from Spain, it is expected that GES in the Western Mediterranean is currently not reached but data from breeding colonies along the southern coasts of this region were not available.
Common Indicator 5: Population Demographic Characteristics (Audouin’s Gull Ichthyaetus audouinii )
939. Annual survival rates have been assessed in France, (~1.0, Western Mediterranean). Annual reproductive success rates are reported to be very low in Croatia (0.02, Adriatic Sea) and vary strongly between subregions in Italy (0.83 for the Adriatic, 0.31 for the Central and Ionian Sea, 0.27 for the Western Mediterranean). For France, reproductive success is reported to be 0.99. In the Spanish part of the Western Mediterranean, reproductive success is currently reported to be low (0.35), however it has improved as compared to the previous assessment cycle (0.27). Baseline data for hatching and fledgling success have been provided for the Greek part of the Aegean and Levantine Sea subregion. Overall, the data quality appears too patchy for a GES assessment of CI 5 for Audouin’s Gulls in the region, but the data presented here indicates that GES for this vulnerable marine gull species is likely not reached.
Slender-billed Gull Chroicocephalus genei
940. The Slender-billed Gull is not strictly a marine species. It forages mainly on fish, crustaceans and insects. The nest in colonies, situated in estuaries, marshes, river valleys and on beaches contains three to four eggs. The species is a partial migrant and can be found in the Mediterranean year-round. Outside the breeding period it can be observed across the region in coastal areas.
941. The global population of this species, which is estimated at 310,000-380,000 individuals (Wetlands International, 2021), is listed as Least Concern, but the population in the European part of the region is known to be decreasing (<25% in three generations (Birdlife International 2023). CPs in the region with breeding populations are France, Greece, Italy, Spain, Tunisia, and Türkiye.
Common Indicator 3: Species Distributional Range (Slender-billed Gull Chroicocephalus genei )
942. Breeding distribution baseline data are provided for Italy and can be utilised for future assessment cycles. The species has been confirmed to be absent as a breeding species from Albania during the current assessment cycle. Slender-billed Gulls have been reported wintering commonly in all subregions. To assess whether GES is reached regarding the winter distributional range of the species, CPs would need to provide data on current and baseline winter distribution.
943. Overall, the lack of data especially on breeding distributional range for the current assessment cycle but also for baseline values is preventing a GES assessment of CI 3 for the species.
Common Indicator 4: Population abundance of selected species(Slender-billed Gull Chroicocephalus genei )
944. Data on breeding population abundance are available for Spain and France. For the Spanish population the relative breeding population in 2017 is assessed at 0.29-0.31 using a modern baseline The relative population abundance in the French part of the Western Mediterranean is assessed slightly higher at 0.39. If these data are indicative for the subregion in general and for the entire region, GES regarding CI 4 is not reached. However, CPs would need to provide data on breeding population numbers of the current and previous assessment cycle to allow for a region wide GES assessment.
945. Data from IWC mid-winter counts reveal that an average number of close to 000 individuals ‘winter across the region, approximately two thirds of them in Tunisia.
Common Indicator 5: Population Demographic Characteristics(Slender-billed Gull Chroicocephalus genei )
946. Data on population demographic characteristics of Slender-billed Gulls in the region are available for the Western Mediterranean region from France. There, the annual survival rate is assessed at 0.97 (2016-2021) while the average reproductive success rate is 0.98 (2015-2021). This would mean that GES is tentatively reached there for CI 5. However, demographic parameters would need to be collected across the region to allow modelling population growth rates for the Mediterranean breeding population of the Slender-billed Gull.
Lesser-crested Tern Thalasseus bengalensis emigrates
947. The global population of the species, listed as Least Concern by IUCN, is estimated at 225.000 birds. However, the subspecies emigratus, which is endemic to the region numbered some 4000 birds in 1993, or a maximum of less than 2300 pairs in 2009 (Hamza et al., 2011). With Libya (Central Mediterranean Region) being currently the only country with breeding colonies in the region, the Mediterranean population is extremely vulnerable due to small population size and restricted distribution range in very few colonies.
Common Indicator 3: Species Distributional Range (Lesser-crested Tern Thalasseus bengalensis emigrates)
948. No data are available regarding the breeding distribution of Lesser-crested Terns during the current assessment cycle. Therefore, GES of the species regarding CI3 cannot be assessed. However, there is no indication of an increase in the breeding distribution range of species. Due to the very restricted range, it is likely that GES in the region is currently not reached.
Common Indicator 4: Population abundance (Lesser-crested Tern Thalasseus bengalensis emigrates)
949. There is no data available on breeding population abundance of Lesser-crested Terns during the current assessment cycle. Single-digit figures of the species have been reported during the current assessment cycle along the southern Mediterranean coast, namely from Libya (Central Mediterranean), Algeria and Morocco (Western Mediterranean Region) encountered during IWC midwinter counts. A robust GES assessment based on these few winter records seems currently not possible.
Common Indicator 5: Population Demographic Characteristics (Lesser-crested Tern Thalasseus bengalensis emigrates)
950. For the current assessment cycle, no data on population demographic characteristics such as annual survival rates and reproductive success were available to identify the population growth This means that GES of CI 5 for the Lesser-crested Tern population in the region currently cannot be assessed.
Sandwich Tern Thalasseus sandvicensis
951. These birds breed in relatively dense colonies, exclusively in coastal areas with available feeding grounds close by. The population inhabiting the Mediterranean and Black Sea Region is estimated at 20270 – 65670 breeding The global conservation status is Least Concern and assessed as stable, the population trend in the region is fluctuating.
Common Indicator 3: Species Distributional Range (Sandwich Tern Thalasseus sandvicensis)
952. CPs with breeding populations in the region are France, Greece, Italy, Spain and Türkiye, and the species is reported breeding in all subregions.
953. Data on changes in the breeding distribution range for the current assessment cycle as compared to a modern baseline (2010-2016) is available for the Adriatic subregion (Italy). The data reveal a relative breeding distributional range of 64. This reduction in distributional range indicates that GES of CI 3 for the Adriatic breeding population of the Sandwich Tern is not reached.
954. The species has been reported wintering in all subregions with data from IWC mid-winter counts provided by the majority of CPs. Relative wintering distributional range is assessed as stable (1.0) for parts of the Adriatic Sea (Albania and Croatia, modern baseline). It can be assumed that GES regarding the wintering range of the species is reached for the entire Adriatic and potentially for the whole region, however CPs would need to provide data on current and baseline range assessments (e.g., occupied versus assessed grid cells) to confirm this.
Common Indicator 4: Population abundance of selected species (Sandwich Tern Thalasseus sandvicensis)
955. The relative breeding bird abundance has been provided for the Western Mediterranean (France: 32; Spain: 0.91). GES of CI 4 for the Sandwich Terns breeding in this subregion is close to the lower threshold level of 0.7 but not reached (0.68).
956. Breeding pair numbers for the current assessment cycle have been provided for the Adriatic population (Italy), but baseline values would need to be provided to assess GES.
Common Indicator 5: Population Demographic Characteristics (Sandwich Tern Thalasseus sandvicensis)
957. Data on demographic parameters is only available from France for the Western Mediterranean subregion for both, annual survival rate (0.97) and reproductive success (0.99), which means that GES regarding CI 5 in part of the subregion is reached.
958. Data on average annual reproductive success during the current assessment cycle has been provided for the Adriatic Sea subregion (0.46; Italy). The value appears low for GES on CI 5 to be reached in the subregion.
Mediterranean Storm-petrel Hydrobates pelagicus melitensis
959. The Mediterranean Storm-petrel breeds in colonies among boulders and in sea caves on rocky islands and islets. The females lay a single egg. The birds are highly mobile, but also highly philopatric. At least part of the population leaves the Mediterranean into the Atlantic during the non- breeding season. The population of the Mediterranean subspecies of the European Storm-petrel which is endemic to the region is estimated at around 13000-17000 breeding pairs (Birdlife International 2021). Most known breeding colonies are distributed in the central and western Mediterranean with a large proportion of the population restricted to a few archipelagos and with Malta holding 50% and Italy holding 30% of the population.
Common Indicator 3: Species Distributional Range (Mediterranean Storm-petrel Hydrobates pelagicus melitensis)
960. Breeding distributional ranges assessed against modern baselines are available from parts of the Central Mediterranean and Ionian Sea for Albania: 0.33, Italy: 1.0, and Malta: 2.33. However, it has to be noted that the apparent increase in distribution range in Malta is mainly attributed to an increase in knowledge. Data on relative distributional range are also available from part of the Western Mediterranean subregion, namely Italy: 0. As Italy and Malta combined hold approximately 80% of the entire population in the region, GES regarding the species’ breeding distribution is reached at least for the Central Mediterranean and Ionian Sea subregion and when taking a modern baseline approach.
961. Additionally, relative breeding distributional range data are available from Greece for the Aegean and Levantine Sea subregions: 0. Furthermore, a small colony has been discovered recently in the Southern Adriatic Sea subdivision, leading to a range increase for the CP.
962. At-sea distribution is exemplarily presented as 50%UD core foraging areas and 95%UD home ranges from GPS- and GLS-tracked individuals from some colonies in Italy, Malta and Spain.
Common Indicator 4: Population abundance Mediterranean Storm-petrel Hydrobates pelagicus melitensis)
963. For the current assessment cycle, population abundance data are available for parts of the subregions Western Mediterranean (France, Italy, Spain), Central Mediterranean and Ionian Sea (Albania, Italy, Malta), Aegean and Levantine Sea as well as the Adriatic Sea subregion (Greece).
964. For the Western Mediterranean subregion, France reports a current population of 130 bp, leading to a relative population abundance of 9.29 as compared to a modern baseline. Italy reports a current population abundance of 1459-1776 breeding pairs for the Western Mediterranean without providing a baseline, while Spain provides a current population abundance of 528 breeding pairs against a modern baseline of 3347 breeding pairs. However, for many Spanish nesting sites of the species no data are provided for the current assessment period. Therefore, no relative breeding population abundance is calculated for Spain.
965. For the Central Mediterranean and Ionian Sea, Albania provides a relative breeding population abundance of 1.0 (0-50 breeding pairs in both current and modern baseline assessment). Italy provides a current breeding population of seven pairs (without a baseline). Malta provides an average relative breeding population abundance 1.27 (breeding population estimate from 2019 CMR and modelling: 8197-8397 pairs). Due to the apparent slight population increase of the largest Mediterranean Storm-petrel colony in Malta, GES is assessed as being reached for CI 4 at least in the Central Mediterranean and Ionian Sea subregion.
966. Data from Greece indicate a population increase for the Aegean and Levantine Sea subregion as well as for the Southern Adriatic However, this apparent population increase is mainly attributed to an improve in knowledge. In order to confirm whether GES regarding CI 4 for this small and elusive seabird species is also reached for the entire region, CPs would need to provide current breeding pair numbers against baseline values across the range.
Common Indicator 5: Population Demographic Characteristics Mediterranean Storm-petrel
Hydrobates pelagicus melitensis)
967. For the current assessment cycle, no data of reproductive success were provided. The adult annual survival rate is available for Malta’s largest Storm-petrel colony, modelled from CMR It is assessed at 0.87 for the period 2013 – 2021. As the colony has experienced a slight population growth over the last two assessment cycles (see CI 4) it can be assumed that GES for CI 5 is reached locally.
Scopoli’s Shearwater Calonectris Diomedea
968. The Scopoli’s Shearwaters are nocturnal in the colonies, highly mobile, but also highly philopatric. During foraging trips, they can cover large Almost the entire population spends the non-breeding period (November-March) outside the region, mainly in the Atlantic, which means that some pressures may act on the species outside the region.
969. The species is near-endemic in the region, distributed over a wide range across the Mediterranean, with strong-holds in the Western and Central Mediterranean subregions. CPs with confirmed breeding populations are Algeria, Croatia, France, Greece, Italy, Malta, Spain, and Furthermore, breeding is suspected in Türkiye.
970. The breeding population of this regional near-endemic species is estimated at 285,000- 446,000 mature individuals (Birdlife International 2023). The species’ single largest colony on Zembra Island, Tunisia, has been relatively recently reassessed at 141,000 to 223,000 breeding pairs (Defos du Rau et al 2015). Its conservation status is currently Least Concern with a long-term negative population trend and a reduction in range at least in the European part of the distribution area.
Common Indicator 3: Species Distributional Range (Scopoli’s Shearwater Calonectris Diomedea)
971. In the Adriatic Sea subregion, Albania reports for the species a reduction from 5 grid cells (50km x 50km) down to 0, while Croatia and Italy in the same subregion report a relative breeding distribution range of 1.0. (13 occupied grid cells overall, 10km x 10 km). For the Central Mediterranean and Ionian Sea subregion data provided by Greece (one colony) and Italy reveal a relative breeding distribution range assessment of 1.0. In Malta, relative breeding distribution is assessed at 1.19, with improved knowledge of colony sites causing the apparent increase. In the Western Mediterranean subregion, Italian data reveal a relative breeding distribution range of 0.97, within threshold level (10%). The GES for CI 3 is not assessed for any of these subregions due to insufficient data.
972. The at-sea distribution is exemplarily presented as 50%UD core foraging areas and 95%UD home ranges from GPS-tracked individuals from three colonies in Italy (Central and Ionian Sea, Western Mediterranean), one colony in France and three colonies from Spain (Western Mediterranean).
973. Overall, the lack of comparable current assessment and baseline data on breeding and at-sea distribution range, prevent from assessing GES of the species regarding CI 3 across the region.
Common Indicator 4: Population abundanceScopoli’s Shearwater Calonectris Diomedea)
974. The majority of the population leaves the Mediterranean region to spend the winter period (November to February) in the Atlantic, off the Western African coast. Therefore, population assessments during the non-breeding period appear not representative and thus not meaningful for a GES assessment.
975. Relatively robust baseline breeding population estimates are available for the majority of Scopoli’s Shearwater colonies in the region, with a modern baseline estimate of 140,184 – 215,626 breeding pairs, more than 80% of them on Zembra (Tunisia, Western Mediterranean). Only for some colonies (approximately 17%-22%) of the breeding population there are current population abundance assessments available. For the single largest colony holding the majority of the species’ population, no breeding population estimates have been provided for the current assessment cycle. Available data on relative breeding population abundance draw a heterogenous and non-conclusive picture for CI 4 of the species within subregions and across the region; Adriatic Sea: 0.79-98 (Croatia) to 1.35-1.47 (Italy), Central Mediterranean and Ionian Sea: 1.0 (Greece), 1.13-1.23 (Italy) and 0.56-0.78 (Malta), and Western Mediterranean: 0.92 (France), 0.98-2.53 (Italy) and 1.01 (Spain).
976. Overall, the current data quality and availability does not allow for a conclusive GES assessment of CI 4 in the region.

Figure 55: Examples of distribution of bird species. A) Gulosus aristotelis desmarestii; B) Ichthyaetus audouinii (Spanish colony); C) Hydrobates pelagicus melitensis (from colonies in Italy, Malta and Spain); D) Calonectris diomeda (from one colony in France, three colonies in Italy, and three colonies in Spain); E) Puffin yelkouan (from colonies in Greece, Italy and Malta). Home ranges (95% UD, light orange) and core foraging areas (50% UD, dark orange) of GPS tracked adults. A and B refers to the Western Mediterranean subregion during the breeding season, C and D refers to distribution in the whole Mediterranean region, E refers to distribution in the whole Mediterranean region during the breeding season
Common Indicator 5: Population Demographic Characteristics Scopoli’s Shearwater Calonectris Diomedea)
977. Annual survival rates from the current assessment cycle are available for two colonies in the Western Mediterranean (Italy: 88 and Spain: 0.83). Reproductive success rates are available for colonies in the following subregions: Adriatic Sea: Croatia: 0.73-0.79; Central and Ionian Sea: Greece: 0.65, Italy: 0.59 and Malta: 0.70-0.72; Western Mediterranean: Italy; 0.69 and Spain: 0.74.
978. No information has been provided regarding demographic parameters of Scopoli’s Shearwater colonies in the Aegean and Levantine Sea subregion, nor for the single largest colony in the region (Zembra, Western Mediterranean). Overall, the data quality and availability currently do not allow for an assessment of CI 5 in the region.
Yelkouan Shearwater Puffinus yelkouan
979. This region-endemic species is an obligate marine species and strictly nocturnal in the colonies. Females lay one egg per season. Birds can be found in the Mediterranean year-round, but part of the population moves eastwards and spends the non-breeding period (July-November) in the Black Sea, which implies that some pressures on the species may be active outside the region.
980. The population is estimated at 15,337-30,519 pairs, roughly equating to 46,000-92,000 individuals (Derhé, 2012). Strongholds of the population are found in the central and eastern Mediterranean. In the Western Mediterranean subregion (Balearic Islands) it is replaced by the sibling taxon mauretanicus, with which it may form a stable hybrid population on Menorca. Countries with confirmed current breeding populations are Albania, Algeria, Croatia, France, Greece Italy, Malta, Algeria, and Tunisia. In the past breeding was also confirmed for the Bulgarian Black Sea area and Yelkouan Shearwaters are suspected to breed in Türkiye.
981. The conservation status of the species has been assessed as Vulnerable with a decreasing population trend, the latter being to some extent mitigated by improved knowledge of this elusive breeder, including the discovery of new colonies in recent years leading to an apparent population increase.
Common Indicator 3: Species Distributional Range (Yelkouan Shearwater Puffinus yelkouan )
982. Relative breeding distributional range data are available for parts of the Adriatic subregion, namely Albania, Croatia and Italy. Overall, the relative breeding distributional range was assessed at 0.64, indicating a range contraction in the subregion.
983. For parts of the Central Mediterranean and Ionian Sea subregion (Albania, Italy, Malta) the relative breeding distributional range was assessed at 39. However, the apparent increase in breeding distributional range can be mainly attributed to the discovery of formerly unknown colonies in Malta due to increased monitoring effort, rather than to a true range expansion. A similar picture is given for the Aegean and Levantine Sea subregion (Greece), where the discovery of colonies in the recent past leads to a relative breeding distributional range of 1.1.
984. For parts of the Western Mediterranean region (Italy) the relative breeding distributional range was assessed at 0.89, indicating a slight range contraction in this subregion, just outside the 10% threshold bracket.
985. Overall, it can be assumed that due to range contractions specifically in the Adriatic and less pronounced in the Western Mediterranean, GES for the vulnerable Yelkouan Shearwater concerning CI3 is currently not reached.
986. The at-sea distribution of Yelkouan Shearwaters in the region is exemplarily presented as 50%UD core foraging areas and 95%UD home ranges from GPS- and GLS-tracked individuals from a colony each in the Western Mediterranean (Italy), Central and Ionian Sea (Malta) and Aegean and Levantine Sea (Greece).
Common Indicator 4: Population abundance (Yelkouan Shearwater Puffinus yelkouan )
987. Systematic bi-monthly passage counts at a bottleneck (Bosporus), where a major part of the population is known to migrate through, show the cyclic and consistent nature of passages. This method can be used as a supporting monitoring tool for the species and can reveal relative abundance data here and at other bottlenecks.
988. Relative breeding abundance data are available from parts of the population spread over most subregions. In the Adriatic Sea, the relative breeding population abundance is assessed at 83 to 2.0 for Croatia, while it is assessed at 2.87 to 3.9 for Italy. In the Central and Ionian Sea subregion, relative breeding abundance is assessed at 1.0 for Albania, 0.59 to 1.2 for Italy and 1.08 to 1.33 for Malta. In the Western Mediterranean subregion, the relative breeding abundance is assessed at 0.11 for France and Italy 1.06 to 1.35. For the Aegean and Levantine subregion, the relative breeding population abundance is assessed at 1.96 to 2.01 (Greece).
989. The wide ranges between lower and upper values for Yelkouan Shearwater populations in some of the CPs reflect the difficulty to assess CI 4 in this elusive species. The very high relative values of 1,83-3.9 for some CPs, indicating a strong increase of the population, can be mainly explained by an apparent population increase due to improved knowledge, while values between 1 and 1.5 could indicate true population recovery compared to baseline levels due to implemented conservation actions.
990. Overall, the gaps and heterogeneity in available data for this vulnerable species currently don’t give a clear picture of the situation and prevent a truly quantitative assessment of GES regarding CI 4.
Common Indicator 5: Population Demographic Characteristics (Yelkouan Shearwater Puffinus yelkouan )
991. For the current assessment cycle, modelled annual survival rates from CMR data in the colonies are available for one CP in the Central Mediterranean (Malta). With just above 0.7 they appear relatively low (baseline assessed at 0.74).
992. Annual reproductive success rates are available for part of the Adriatic Sea subregion (Croatia, 0.63-0.65), the Central Mediterranean and Ionian Sea subregion (Malta, 43-0.70) and the Western Mediterranean subregion (Italy, 0.44). Baseline levels of reproductive success rate are available for one large colony in the Aegean and Levantine subregion (Greece), evaluated during the previous assessment cycle. With values between 0.18 – 0.38 they appear very low.
993. Although data quality does not allow for a quantitative GES assessment of CI 5 for the species across the region, it is not likely that a population growth rate of >1 is reached, which would be necessary for a species recovery and thus for reaching GES.
Balearic Shearwater Puffinus mauretanicus
994. The Balearic Shearwater is the sibling taxon to the Yelkouan Shearwater, closely related and very similar and thus sharing the same functional ecological group Offshore surface or pelagic feeder.
995. In fact, latest research on the genomics of the genus Puffinus suggests that the two taxa show low genetic differentiation, not above the level of subspecies (Obiol et 2023), with potential consequences for management and conservation decisions.
996. The species is obligate marine and its nest are found in burrows, caves or crevices and females lay one egg per season. They are highly mobile, covering large areas during foraging trips. The birds are nocturnal in the colonies and show philopatry and high site fidelity. After the breeding period, most birds move westwards to spend the non-breeding period (August to December) in the East Atlantic. This means that some pressures on the species are active outside the region.
997. Population estimates for the Balearic Shearwaters are 19,000 – 25,000 mature individuals (Birdlife International 2023), 2,000-2,400 breeding pairs (Oro et al., 2004) or 7,200 breeding pairs (Genovart et al., 2016). The entire known breeding population is restricted to the Balearic Islands, Spain. The species is listed as Critically Endangered with a rapidly declining population trend.
Common Indicator 3: Species Distributional Range (Balearic Shearwater Puffinus mauretanicus)
998. No data have been provided in the current assessment cycle by the CP regarding the species’ breeding distributional range and the at-sea distribution and the non-breeding distribution.
Common Indicator 4: Population abundance of selected species (Balearic Shearwater Puffinus mauretanicus)
999. As a baseline, the average number for the period 1990 to 2016 is provided as 2369 breeding pairs. For the year 2018 in the current assessment cycle, the breeding population is assessed at 351 breeding pairs. However, it appears that only a few colonies were monitored in both assessment cycles, and they do not overlap to an extent where comparison is Due to the unfavourable conservation status of the species, GES is currently not reached regarding CI 4.
Common Indicator 5: Population Demographic Characteristics (Balearic Shearwater Puffinus mauretanicus)
1000. No data on the adult annual survival rates are available of the species for the current assessment cycle. The reproductive success rate for the current assessment cycle was at 0.7 in 2017 and had been assessed at an average of 0.63 in the period 1986-2016.
1001. For the closely related Yelkouan Shearwater, Oppel et al. (2011) stated that annual survival rates of adults would need to be >0.9 to consider the population to be sustainable. The reproductive success would need to be >0.75 to allow for a recovery or growth of the population (Louzao et al., 2006). Therefore, it is highly likely that GES for CI 5 for this critically endangered species is currently not reached.
Key findings per Common Indicator (CIs 3, 4 and 5 for Bird species)
1002. For CI3, the species’ distributional range, the results of the assessment indicate overall compliance with GES targets for seabirds in the Mediterranean. This can be partially explained by taking a modern baseline approach and by apparent range expansion due to increased monitoring and assessment effort for some species. However, it must be noted that the range assessment mainly focused on the breeding distributional range as larger data gaps remain for a more complete assessment of the at-sea- and non-breeding distribution of many indicator species across the region.
1003. For CI4, the current patchiness and heterogeneity of data and the larger gaps in datasets prevent a comprehensive, truly quantitative GES assessment of population abundance of seabirds across the region. However, the available datasets point towards a heterogenous picture, with some species in some countries (or subregions) reaching GES target compliance while others do not. Lack of information on pristine, historical and in some cases even modern conditions impede the abundance assessment for the current cycle. Overall, it appears that assessment results particularly for populations of the species of conservation concern in the region might currently not be compliant with GES targets.
1004. For CI5, the data availability across the indicator species and across the region appears currently insufficient for assessing compliance of this CI with GES targets quantitatively. Demographic parameters such as annual survival rates remain relatively poorly monitored overall. Examples of populations, for which CI5 seems sufficiently monitored suggest that it might be the CI for which GES overall is not reached, especially when assessing species of conservation concern.
1005. The assessment of Mediterranean seabird populations has come a long way since the initial MED QSR (2017). While the 2017 report qualitatively described the status of seabirds in the region without providing GES assessments, there has been significant improvements towards at least a semiquantitative assessment for all CIs, at least for some indicator species and for some populations in the region.
1006. Increased international collaborations, including integrated and representative approaches, knowledge transfer and concerted, comparable efforts are now necessary in order to reduce existing knowledge gaps and allow for a truly quantitative assessment of GES of seabird related indicators in the entire region.
Measures and actions required to achieve GES (CIs 3, 4 and 5 for Bird species)
1007. For the current assessment cycle, the results of the GES assessment regarding seabirds present an improvement in data availability and in applied methodologies when compared to the previous assessment cycle. It is possible to draw some preliminary conclusions using available quantitative monitoring data and assessment methodologies. For some indicator species and CIs sufficient data was available at a national scale, allowing for an assessment that reflects the impact of reduced pressures on local populations. Therefore, it highlights the importance of regular monitoring efforts to inform on the success of implemented conservation actions. However, for the current assessment cycle, the data that was made available remains patchy, heterogenous, and limited for a robust GES assessment of all indicator species for the three CIs across subregions. It is believed that the IMAP Infosystem will facilitate data reporting and improve efficiency and comparability for monitoring and GES assessments of future cycles.
1008. Currently, the lack of representative, comparable subsamples distributed equally across the subregions remains one of the major challenges for an integrated assessment of the status of marine avifauna in the region. To achieve a robust GES assessment, monitoring data between two cycles should be made fully comparable. This requires monitoring a certain number of same or representative populations as prolonged time series at the finest spatial scale practical.
1009. In order to improve the representativeness of monitoring samples, coordinated monitoring within subdivisions or subregions would further improve overall GES assessments. Mid-winter count data made available by IWC for this assessment cycle as well as transboundary counts of Mediterranean Shag roosts in the Adriatic are good examples highlighting useful outcomes of coordinated and synchronised monitoring efforts.
1010. Enabling coordinated efforts and achieving standardised monitoring at the local level also requires regular transfer of know-how and calibration of monitoring methods within subdivisions, subregions or across the region. Finally, harmonisation between different assessment programmes such as MSFD can be further improved for a more efficient assessment of GES in the Mediterranean.
1011. Quantifying GES for seabird populations in the Mediterranean remains challenging. Seabirds are highly mobile organisms and therefore a robust analysis of their state requires transboundary monitoring. Ensuring communication and information exchange between different assessment programmes and sea conventions within the region and for migratory species which leave the Mediterranean also other seas can help overcome this challenge.
1012. The majority of seabird species in the Mediterranean form metapopulations with discrete local breeding colonies. Without better understanding the demographic connectivity between these colonies, deciding on a meaningful spatial scale at which GES should be assessed remains to some extent arbitrary. Therefore, closing such knowledge gaps will be pivotal for the finetuning of monitoring programmes and for successful GES assessments in the future.
1013. Currently, a strong bias remains in the amount of monitoring data available for the different aspects in the life cycle of the majority of Mediterranean seabirds. This bias means that there is insufficient knowledge regarding the non-breeding season and the periods the birds spend out at sea, often far away from the breeding grounds. To reduce this bias, it is recommended that future assessment cycles increase the effort of monitoring the birds away from the colonies, by means of increased colour ringing and ring-reading, tracking programmes and counts at bottlenecks.
Common Indicators 3, 4 and 5 (Monk Seal)
1014. Mediterranean monk seals (Monachus monachus) were once widely and continuously distributed in the Mediterranean and Black Seas, and in North Atlantic waters from Morocco to Mauritania, including the Cape Verde and the Canary Islands, Madeira, and the Azores (Johnson et al. 2006). Today fewer than 700 individuals are thought to survive in isolated subpopulations in the eastern Mediterranean, the archipelago of Madeira and the Cabo Blanco area in the north-eastern Atlantic Ocean (Karamanlidis et al. 2015). The largest aggregations of Mediterranean monk seals are found near Cabo Blanco (González and Fernandez de Larrinoa 2012, Martínez-Jauregui et al. 2012). Principal sites in the Mediterranean are located in the Ionian and Aegean seas, including the National Marine Park of Alonissos (Trivourea et al. 2011) and the Gyaros Marine Protected Area (Dendrinos et al. 2008), both in Greece. An increasing presence of monk seals has been also reported in the Levantine Sea (Beton et al., 2021; Kurt and Gücü 2021; Roditi-Elasar et al., 2021; SPA/RAC- UNEP/MAP, 2020). Moreover, within the Mediterranean Basin, there are recent indications that seals might be frequenting areas within their historical range where they had been extirpated in previous decades (Bundone et al., 2019).
1015. Historical evidence suggests that Mediterranean monk seals commonly used to haul out on open beaches (Johnson and Lavigne 1999, González 2015). Still, in more recent times — probably as an adaptation to increased human disturbance — they generally seek refuge in remote marine caves.
These natural rocky shelters share common morphological characteristics, including one or more entrances above or below water level, an entrance corridor, an internal pool, and a beach that provides a dry haul out area (Dendrinos et al. 2007). While at sea, Mediterranean monk seals have been reported sleeping, either at the surface floating (vertically or horizontally) with eyes closed or resting underwater on the seafloor or over seagrass beds with eyes and nostrils shut (Karamanlidis et al. 2017, Mpougas et al. 2019). On all occasions, seals proved to be easily wakened when approached by humans.
1016. The monk seal populations at Cabo Blanco in the Atlantic, and at Gyaros Island in the eastern Mediterranean, are the only large extant aggregations of the species that still preserve the structure of a colony, while remaining subpopulations in the eastern Mediterranean are usually small, fragmented groups of <20 individuals (Karamanlidis et al. 2015).
Assessment methodology for CI3, CI4 and CI5 of EO1 regarding Monk Seal
- For the 2023 MED QSR Mediterranean Monk seal assessment to be successful, the main experts working with this endangered species were contacted by SPA/RAC and were kindly asked to provide relevant data on Mediterranean monk seal, covering the three above-listed Common Indicators.
- To facilitate the data collation process, a questionnaire was produced, as an Excel file (See document provided together with this report with all responses), including four different spreadsheets covering different aspects, namely data supplier information, species distributional range, population abundance, and demographic characteristics.
- Participants in this survey were requested to also provide any available reports on the three CIs of Mediterranean monk seal and point out any links to additional data, data depositories and contacts of data-holders that might be beneficial to further enhance the assessment. In addition, participants that may consider that they do not have sufficient quantitative data regarding the three CIs, were encouraged to provide or point at any additional information that might allow at least for a qualitative assessment of the Good Environmental Status.
- The 2023 MED QSR assessment for the Mediterranean monk seal does not only rely on the participation of these experts, in order to count with the most updated and detailed information, but also on the scientific literature available for the species. The above-mentioned questionnaire was shared with 29 experts from 16 countries.
1017. The present assessment provides insight into both the strengths and limitations of the current status of the Mediterranean monk seal across the Mediterranean basin:
-
- In the areas where monk seal breeding had been reported (see “Group A” countries in GES section below), the species continues to breed.
- In all areas where no monk seal breeding takes place, but repeated sightings of monk seals were reported (see “Group B” countries in GES section below), the species continues to be present, and the most recent data shared by experts, through the survey conducted to produce this assessment, indicate a moderate expansion of the specie’s range.
- Consequently, if habitat suitable for the species is available (and protected), they offer good potential for new breeding episodes.
- All research and conservation groups (data providers) have agreed in reporting problems related to disturbance and habitat loss, which seem to pose a widespread threat throughout the species’
- The reported wider distribution of the species across the basin in recent times has led to an increase in the number of “players” in the Mediterranean monk seal conservation “game”. These research and conservation groups, some of them with a need for capacity building and training initiatives, consider necessary to increase monitoring In this regard, a significant number of organizations carrying out monitoring activities on Mediterranean monk seals, were not able to respond to the set of questions focussed on demographic parameters, included in the questionnaire (see Methodology section). This lack of response suggests that in many areas an optimal level of (regular) monitoring effort was not achieved in order to obtain these parameters.
- Following up on the above, for instance, groups working in Israel and the Adriatic Sea were not able to respond to these demographic parameters, possibly as a consequence of both a low level of monitoring effort and a very low monk seal presence.
- By improving our capacity to establish the basic demographic parameters for this endangered species, we would be also advancing in our capacity to produce more fine-tuned total population estimates. Recent new approaches to infer population numbers from pup multiplier ratios may largely benefit from it, since there is still a significant knowledge gap on pup survival rates.
- Breeding caves and foraging areas need to be identified and Conservation management action should not be limited to monitor resting and haul-out areas.
- There is a lot of data collected, although not always in a homogeneous format or by applying commonly agreed methodologies and procedures. Therefore, this wealth of data it is often not comparable between different sites and research groups. This important issue could be overcome through the establishment of commonly agreed monitoring protocols and a data sharing platform. New initiatives led by the Monk Seal Alliance seem to provide good momentum to address this recurrent request by Mediterranean monk seal researchers and conservation bodies.
Good environmental status (GES) assessment (CIs 3, 4 and 5 for Monk Seal)
1018. The main problem encountered in envisaging a region-wide Strategy derives from the quite diverse conservation status of monk seals in the different portion of the Mediterranean and by consequence the quite different priorities and responsibilities saddled onto the various monk seal Range States.
1019. When developing an updated regional strategy for the conservation of monk seal in the Mediterranean (Decision IG.24/7) this challenge was tackled by assigning Mediterranean countries to three groups. Consequently, the following criteria has been also followed for this assessment taking under consideration the information provided by regional experts:
-
- “Group A” countries, where monk seal breeding has been reported after year 2010.
- “Group B” countries, where no monk seal breeding is reported, but with repeated sightings of monk seals (>3) were reported since 2010.
- “Group C” countries, where no monk seal breeding is reported, and where very rare or no sightings of monk seals (≤3) were reported since 2010.

Figure 56: Monk seal conservation status by country, adopted from updated regional strategy for the conservation of monk seal in the Mediterranean (2019). Green: “Group A” countries; yellow: “Group B” countries; tan: “Group C” countries.
Note: Syria has been moved to Group B based on feedback produced by regional experts.
1020. The mid-term implementation of the regional strategy for the conservation of monk seal in the Mediterranean was recently assessed by examining each of its Goal Targets and providing input on the degree of their implementation and achievement (UNEP/MED WG.548/8 Rev.2). This assessment, presented during the Sixteenth Meeting of SPA/BD Focal Points (Malta, 22-24 May 2023) recommended to set up the Monk Seal Advisory Committee no later than December 2023, in order to provide support to SPA/RAC in the development and implementation of specific conservation actions having a regional scope for the remaining of its period as described in the Strategy itself. Terms of Reference for the committee were also produced.
1021. The GES definition for marine mammals (Monk seal) in relation to the CI3, CI4 and CI5 as adopted by Decision IG.22/7 are as follows:
-
- CI3: Species distributional range: The Monk Seal is present along recorded Mediterranean coasts with suitable habitats for the species;
- CI4: Population abundance of selected species: Number of individuals by colony allows to achieve and maintain a favourable conservation status;
- CI5: Population demographic characteristics: Appropriate measures implemented to mitigate direct killing and incidental catches and to preclude habitat destruction and disturbance.
1022. Considering the GES definition, the current assessment of the status in relation to (CI3, CI4 and CI5), provides insight into both the strengths and limitations of the species across the Mediterranean basin. Most recent data shared by experts, through the survey conducted to produce this assessment, indicate that the species continues to breed in its known breeding zones and there is a moderate expansion of the specie’s range.
1023. The present assessment concluded that for CI3-distribution, GES has not been achieved for all Group B countries (where no monk seal breeding is reported, but repeated sightings were reported), while it has been achieved for most of the Group A countries (countries, where monk seal breeding has been reported after year 2010). However, the lack of a baseline estimates for monk seal population abundance (CI4), makes difficult to validate the (likely) expansion of the species reported in recent years.
1024. Concerning the Monk Seal Population demographic characteristics (CI5), various types of data need to be gathered to enable accurate description of Mediterranean monk seal population demographics. Key demographic data and survivorship are logistically difficult to determine, requiring access to the seals in remote locations and long-term uninterrupted monitoring to build individual historical series.
GES assessment for CI3 (Distribution) for Monk Seal
1025. For the Monk Seal, one of the flag species of the Mediterranean, the current assessment of the status in relation to (CI3, CI4 and CI5), provides insight into both the strengths and limitations of the species across the Mediterranean basin. Most recent data shared by experts, through the survey conducted to produce this assessment, indicate that the species continues to breed in its known breeding zones and there is a moderate expansion of the specie’s range. The present assessment concluded that for CI3-distribution, GES has not been achieved for all Group B countries (where no monk seal breeding is reported, but repeated sightings were reported), while it has been achieved for most of the Group A countries (countries, where monk seal breeding has been reported after year 2010). However, the lack of a baseline estimates for monk seal population abundance (CI4), makes difficult to validate the (likely) expansion of the species reported in recent years.
GES assessment for CI5 (Population demographic characteristics) for Monk Seal
1026. Various types of data need to be gathered to enable accurate description of Mediterranean monk seal population demographics. Key demographic data and survivorship are logistically difficult to determine, requiring access to the seals in remote locations and long-term uninterrupted monitoring to build individual historical series. Consequently, these data have not been systematically gathered and reported across the region, which led the authors of the present report to propose it GES unsure for “Group A” countries.
Key findings per Common Indicator (CIs 3, 4 and 5 for Monk Seal)
CI3-distributional range and 2023 data gaps
1027. The Med QSR 2017 targeted marine mammals in general, therefore not focusing specifically on the Mediterranean monk seal. However, most of the key findings and knowledge gaps could be fully attributed to this species. In this sense, the most important knowledge gaps stemmed from the disparity in the global distribution of research effort, with more effort having been made and being made in northern Mediterranean countries, while in some southern Mediterranean countries information on occurrence and distribution came primarily from anecdotal data and very localised research projects. The resulting knowledge gap compromised the identification of protection measures aimed at the conservation of the species on local and regional scales. Accordingly, more sampling and monitoring effort was identified as a basic requirement in the least monitored areas. Since then, a new initiative, the Monk Seal Alliance (MSA), consisting of a consortium of like-minded foundations optimising resources to trigger collaborative conservation and rehabilitation of the Mediterranean monk seal, has committed significant funds to support new research initiatives. Among them, for instance, the Med-Monk seal Project: Enhancing knowledge and awareness on monk seal in the Mediterranean, located in, Algeria, Egypt, Italy, Lebanon, Libya, Morocco, Syria, Tunisia and led by Specially Protected Areas Regional Activity Centre (SPA/RAC), aims at filling the gap of knowledge on the occurrence in these countries categorized as low density countries in relation to the presence of the monk seal and where no breeding episodes have been reported. In this regard, new initiatives, and current monitoring efforts should be yielding valuable information in the early future.
CI4-Abundance and 2023 data gaps
1028. In reference to this CI, the MedQSR2017 focused mainly on knowledge gaps of cetacean species, highlighting the need to provide abundance and density estimates through synoptic levels and to implement the conservation priorities listed by the European directives and the Ecosystem Approach.
1029. For the Mediterranean monk seal there are no density or abundance estimates, and although there is restrictive and specific legislation for the conservation of the species, both in European directives and in regional and national strategies, implementation of these laws is not yet widespread. In this sense, one of the knowledge gaps cited in the MedQSR2017, the lack of baseline critical information is therefore detrimental to conservation and especially in the assessment of trends. Currently it seems that the species is expanding its range with new monitoring initiatives being developed in countries such as Italy, Croatia, Albania, Montenegro and Israel. However, the lack of a baseline estimate makes difficult to validate this (likely) expansion.
CI5-Demographic characteristics and 2023 data gaps
1030. The need for a systematic monitoring programme over time to establish time series is necessary to determine the basic demographic parameters of the species.
1031. Counts of pups seem to have been established as a valid measure of the annual production of the species, on the one hand, and, on the other, by means of different pup multiplier ratios to determine the gross number of adults. However, although pups could be efficiently monitored (and sexed) before their first moult, after this event the monitoring of youngsters results very difficult. This being the case, as indicated in MedQSR 2017, continuous monitoring programmes by means of photo- identification and repeated at regular intervals should be established, since it is the most accurate, and non-invasive way to establish the life story of individual monk seals.
Measures and actions required to achieve GES (CIs 3, 4 and 5 for Monk Seal)
1032. As presented in sections 4 and 5, for CI3-distribution, GES has not been achieved for all Group B countries, while it has been achieved by Group A countries except for Cyprus. Therefore, actions dedicated to facilitating the widespread distribution of the species in all Group B countries and Cyprus should be a priority. Such actions should include not only the set-up of a good monitoring network but also the protection of key habitats for the species and the reduction of any potential threats (e.g.., intentional killings, tourism disturbance).
1033. When looking at Mediterranean monk seal population abundance (CI4), the lack of a baseline estimates makes difficult to validate the (likely) expansion of the species reported in recent years. Based on the reported information by regional experts, it seems that most (rough) population estimates come mainly from the minimum photo-identified individuals. However, a new approach by MOm (Greece) using pup-multipliers method may be taken as a new way forward for reliable abundance estimates. A common strategy for producing population estimates should be agreed on to be able to compare information among researchers.
1034. It must be pointed out that monk seal photo-identification is a widespread practice across the region; therefore, the creation and implementation of a data-sharing platform would offer great potential to establish reliably information on movements and home range establishment. Such initiative is currently in the portfolio of actions to be supported by the Monk Seal Alliance.
1035. Data reported by regional experts manifests the difficulty to study the population demographic characteristics (CI5). Since key demographic data and survivorship are logistically difficult to determine, new actions should focus on providing opportunities for long-term uninterrupted monitoring to allow building individual historical series, key to assess basic demographic trends. New technologies, combined with the long-term regular use of more traditional methods (e.g., individual tags and photo-identification) may shed light on these aspects.
1036. As presented in the newly drafted Mediterranean monk seal DPSIR framework, the following measures and actions should be taken in order to achieve GES for the species:
Research Actions aimed at responding the following questions:
-
- Distribution
- Abundance
- Pup production
- Movements
- Foraging areas
Conservation Measures:
-
- Protect critical pupping habitat
- Regulate human activities
- Improvement of surveillance
- Habitat restoration
Management and Law Enforcement measures:
-
- Regulation of Fishing activities
- Public education and awareness
- Management of tourism
- Reduce anthropogenic mortality
Common Indicators 3, 4 and 5 (Marine Turtles)
1037. The marine reptile theme in the IMAP framework comprises two species of marine turtle that complete their life cycles within the Mediterranean. These are the more widely distributed and abundant loggerhead turtle (Caretta caretta) and the less common and more spatially restricted green turtle (Chelonia mydas). Both species have established endemic Regional Management Units (RMUs) within the Mediterranean (Wallace et al. 2010; Figure 57). However, especially in the western Mediterranean, juvenile loggerhead turtles of Atlantic origin are also common. This complicates the understanding of the efficacy of conservation measures in that subregion as it is not clear if the impacted turtles are part of Mediterranean or Atlantic RMUs.
1038. A third species of marine turtle, the leatherback (Dermochelys coriacea) is also regularly present in the Mediterranean, with individuals originating from the Atlantic, but their numbers in the Mediterranean are low and source populations are large, suggesting that negative impacts on individuals in the region will not adversely affect conservation status of their Atlantic RMU(s).
1039. Good environmental status assessment for marine turtles in the Mediterranean therefore focuses on the two indigenous Mediterranean RMUs of the loggerhead and the green turtle. However, conservation actions to improve the environmental status of these turtles under the biodiversity Ecological Objective (EO1) of the IMAP process of the Barcelona Convention, will also lead to positive impacts on the non-indigenous turtles present in the region.
Key messages (Marine Turtles)
1040. Combining the findings of the three most relevant CIs with literature on research and conservation actions taking place in the Mediterranean, the marine turtle theme can be considered as meeting GES.
1041. Distribution of turtles across the Mediterranean (CI3) is increasing in loggerhead nesting outside their traditional range. Similarly, green turtle distribution at sea is deemed to be expanding.
1042. Nesting levels, a basic proxy for population abundance (CI4) are stable or increasing at all major nesting sites where recent data have been reported and nesting is occurring where there was previously none.
1043. At the breeding areas, available data suggest that hatchling sex ratios (CI5) are in favourable condition. This is the one demographic characteristic that is likely to be impacted by climate change, but it is also one that can be adequately monitored and if required mitigated against.
1044. There are fundamental gaps in monitoring and data reporting for turtles in marine habitats. Monitoring methods and data reporting require standardisation across all CPs. Further research is required for better understanding of turtle populations and improving their conservation status.
Good environmental status (GES) assessment (CIs 3, 4 and 5 for Marine Turtles)
Assessment methodology for CI3, CI4 and CI5 of EO1 regarding Marine Turtles
Data supporting GES assessment of the marine turtle theme in this MED QSR were obtained from multiple sources. The Info System by INFO/RAC did not contain any marine turtle national monitoring data as the system is not ready to ingest such information. Therefore, data were acquired from internet searches that identified primary peer-reviewed scientific literature, reports (grey literature) and in some cases generalist web pages presenting unpublished data records.
These were supplemented with additional unpublished reports shared by SPA/RAC and information found on the Mediterranean Biodiversity Platform (http://data.medchm.net/en/home). Lastly the author approached members of his personal network of Mediterranean marine turtle researchers to obtain information and validation of web-derived specific data points.
The gathered data were entered into spreadsheets relating to each relevant CI. Turtle abundance and distribution at sea (CI3, CI4) were kept as separate sheets as they were distinct sets of data sources whereas abundance and distribution of nesting activity were combined into a single sheet as data sources generally contained information covering both CIs. Population demographic characteristics (CI5) were divided into five sheets, grouped around specific diagnostic topics.
These data were then investigated to determine if they were sufficient to quantify GES status at region, sub-region, subdivision, and national level (Figure 58, Table 34), as set out in the ratified instructional document (UNEP/MED WG.514/Inf.12, 2021).
Integral to the process of determining GES for the different CIs is the requirement to compare current status with either established baseline levels or with threshold values and the outcome of previous GES assessments. For GES to be achieved under CI3 marine turtles need to be present across all their previously established range. As stated in (UNEP/MED WG.514/Inf.12, 2021) presence was assumed unless proven otherwise and available documents and recent distribution maps were examined to identify any such areas where turtles were shown to no longer be present. Similarly for GES to be established under CI4, turtle abundance needs to be at previously established levels across the region. Again, an extensive review of literature was carried out and findings compared with the previous Med QSR. Lastly, the GES assessment for CI5 was attempted through examining available literature for data points mainly focusing on the targets that can be affected/improved by conservation measures, e.g., hatchling emergence success.
Where complete datasets were lacking, the author used their expertise to infer likely GES status and to inform discussion on priority topics in terms of data collection and reporting needs for progress to be made for the subsequent MED QSR in 2029.
1045. Each CI considered in this assessment can be attributed to a colour in a ‘traffic-light’ system, where green equals GES is met, Amber equals uncertain if GES is met, red equals GES is knowingly not met or there are no data on which to make an expert assessment. Ideally this process would be undertaken using prescribed standardised data supplied by all Contracting Parties, which would facilitate the most robust and defensible verdicts, but in lieu of such data being available, information from a variety of sources is compiled to provide a best approximation via expert opinion.
1046. Quantity and quality of data available to carry out this GES assessment varied greatly among countries and was completely lacking for some countries with minor marine areas within the Mediterranean (
1047. Table 35). Results of the assessment for each of the contributing CIs is presented in turn below.
Table 33: Factors considered in defining GES for marine turtles based on UNEP/MED WG.514/Inf.12 (2021)
|
|
CI3 (Species distributional range) The species continues to occur in all its natural range in the Mediterranean, including nesting, mating, feeding and wintering and developmental … sites |
CI4 (Population abundance) The population size allows to achieve and maintain a favorable conservation status considering all life stages of the population |
CI5 (Population demographic characteristic) Low mortality induced by incidental catch. Favorable sex ratio and no decline in hatching rates. |
|||
|
At sea |
Nesting |
At sea |
Nesting |
At sea |
Nesting |
|
|
Spatial scale |
Region Sub-region National |
Region Sub-region Sub-division National |
Region Sub-region National |
Region Sub-region Sub-division National |
Region Sub-region National |
Region Sub-region Sub-division National |
|
National Monitoring requirement |
Six-yearly assessments. Nearshore and offshore habitats |
Six yearly estimates of nationwide nesting locations. |
Annual assessments. Up to 4 nearshore hotspots systematically checked. Ancillary data collected (strandings / fisheries) |
Annual assessments based on nesting level category* Six yearly estimates of nationwide nesting levels. |
Six-yearly assessment review. Bycatch and mortality rates nearshore and offshore. |
Annual assessments. Hatchling Emergence Success, Hatching Sex Ratio |
|
Key target 1 |
No areas identified as no longer utilised by turtles |
Nesting distribution is at least stable: No areas identified as no longer used compared to previous assessment. OR balance between newly exploited and abandoned nesting areas |
Turtle presence remains at same level or increasing at index sites. |
Nesting levels remain at same level or increasing at index sites. |
Assessed mortality rates remain low in nearshore index habitats |
Values for Hatchling Emergence Success to exceed the following levels nationally (per species): loggerhead: 65% green: 75% |
|
Key target 2 |
|
|
Ancillary data do not indicate a decline in turtle abundance nationally. |
Interpretation of six-yearly data to determine that abundance estimates remain stable or increasing in view of potential changing distribution. |
Interpretation of mortality rates from ancillary data to determine national annual survival estimates which should not worsen. |
Hatchling Sex Ratio not to exceed 95% ♀ nationally. |
*Categories are based on levels of nesting. Category 1 = established, common and dense nesting (•••; 75% nesting or 7 sites), Category 2 = established limited and sparse nesting (••; 50% nesting or 4 sites), Category 3 = new emerging low-level nesting (•; continue existing schemes), and Category 4 = Absent or sporadic nesting (#; continue existing schemes). For country classifications see Table 34
Table 34: Data availability and GES status for CI3, CI4 and CI5 relating to marine turtles. Marine turtle species: Cc – Caretta caretta, Cm – Chelonia mydas
Nesting abundance: # – exceptional occurrences, • – new emerging / low level, •• – established limited/sparse, ••• – established common/dense. Monitoring reporting fulfilment: M – Missing, P – Partial, C – Complete. *GES met: Y – Yes, N – No, U – Unknown


Common Indicator 3 (Distribution, Marine turtles)
1048. Marine turtle distribution meets GES from national to regional level (
1049. Table 35 & Table 36). As per guidance (UNEP/MED WG.514/Inf.12, 2021), this can be assumed unless there is direct evidence to the contrary provided by national monitoring schemes. Loggerhead turtles remain present or assumed present in all marine locations, as indicated by recent distribution maps produced (Camiñas et al 2020, DiMatteo et al 2022; Figure 3) and are increasing their distribution in terms of nesting (Hochscheid et al. 2022; Figure 4). Green turtle distribution is assessed to be stable or increasing. The most recent spatial designation for this species in the Mediterranean, compiled by the IUCN Marine Turtle Specialist Group (Figure 3; Wallace et al 2023), is expanded westwards compared with the original extent (Wallace et al 2010), with a recent publication contributing new presence records of green turtles in the Adriatic Sea (Jančič et al 2022). In terms of nesting, sporadic green turtle nesting events have started occurring in Greece (Margaritoulis et al 2023), Tunisia (Ben Ismail et al 2022), and Libya (Saied 2023), which are far west of the traditional nesting region (Casale et al 2018; Figure 4), suggesting that green turtles may be starting a breeding range expansion in the same way as loggerheads.

Figure 57: Turtle distribution across the Mediterranean as indicated by the revised regional management unit extents for Mediterranean loggerhead (A) and green (B) turtles (taken from Wallace(eBt )al 2023).
Table 35: GES status for marine turtle in relation to Common Indicator 3: Distribution. Green = GES met. Orange = Unsure if GES met. Red = GES not met.

Common Indicator 4 (Abundance, Marine turtles)
1050. Based on an incomplete non-systematic dataset, marine turtle abundance is interpreted to meet GES from regional to sub-regional level (Tables 3 & 5). Despite the lack of systematic monitoring data for offshore marine habitats, a region-wide turtle abundance at sea has recently been modelled and published (DiMatteo et al. 2022, Figure 59) which can form a baseline for understanding the difficult-to-determine offshore abundance levels. Nearshore data have not been gathered or published in a systematic manner, as proposed (UNEP/MED WG.514/Inf.12, 2021), but there have been no indications of decreased abundance at any monitored site. For green turtles there are indications that numbers are increasing in the Adriatic Sea (Jančič et al. 2022), which has led to the subregion being included in the RMU extent (see CI3 above). Nesting across the region (
1051. Figure 58) is reported as generally stable or increasing at well-established nesting areas that have received long-term monitoring efforts (Casale et al. 2018), which suggests growing populations. For loggerhead turtles nesting has started to occur more frequently in areas and countries where nesting was not previously reported (Hochscheid et al. 2022), supporting a positive trend and consolidating the positive GES status for this CI.

Figure 58: Beach-scale marine turtle nesting levels across the Mediterranean Sea. Green turtle nesting is confined to the eastern Mediterranean, mainly the extreme north-eastern area, and there are no large nesting aggregations for loggerheads in the western Mediterranean, though nesting levels are currently increasing. Marine turtle nesting in Israel and Malta are depicted in generic locations as beach-scale data are not available

Figure 59: Turtle density across the Mediterranean. Modelled distribution and abundance of hard-shelled turtles (mainly loggerheads) after DiMatteo et al. (2022). The hotspot off the Egyptian coast is generated from extrapolation and requires verification
Table 36: GES status for marine turtle in relation to Common Indicator 4: Abundance Green = GES met. Orange = Unsure if GES met. Red = GES not met.
Common Indicator 5 (Demography, Marine turtles)
1052. In this Common indicator, many types of data need to be gathered to enable accurate modelling of turtle populations, but only a few can be directly influenced by conservation actions. The rest depend on environmental conditions which can be incorporated in models that predict population trends based on differing scenarios. This CI has received least attention from Contracting Parties, in terms of reporting, though publications containing some data exist.Consequently, GES status for this CI remains undetermined for marine turtles across the board from national to regional level (Tables 3 & 6). Focusing on demographic parameters at nesting sites that can be influenced by conservation measures, such as Hatchling Emergence Success and the incubation durations of nests, the data required for this CI, are derived from the basic nesting beach monitoring that takes place at numerous nesting areas across the region, and hence it is believe the data are being gathered but are simply not being compiled and reported by the CPs in a standardised and systematic way. Key demographic data for turtles at sea, such as survivorship and health indices are logistically difficult to determine requiring access to turtles in remote locations and large sample sizes to validate any statistical inferences, and consequently these data have not been systematically gathered and reported across the region.
Table 37: GES status for marine turtle in relation to Common Indicator 5: Demography Green = GES met. Orange = Unsure if GES met. Red = GES not met.

Key findings per Common Indicator (CIs 3, 4 and 5 for Marine Turtles)
Key results for CI 3
1053. The most significant development relating to distribution of turtles across the Mediterranean is the increase in loggerhead nesting outside of the traditional range, with nests being made in the western Mediterranean and Malta and to the north in the Ionian and Adriatic Seas (Fig. 4). This may be considered a positive evolution resulting from moderate global warming, but the negative impacts resulting from continued heating and related sea level rise are yet to be revealed. Similarly, green turtle distribution at sea is deemed to be expanding as indicated in the revised RMU distribution, which may mean this species has new safe locations to exploit but could also mean turtles are lured away from established beneficial foraging areas into less productive ones. The overall at-sea distribution of turtles should remain to be considered the entire Mediterranean region for loggerhead turtles and the area covered by the updated RMU boundary for green turtles, unless evidence to the contrary is gathered by a Contracting Party.
Comparison
1054. This 2023 review is again based on variable data from a wide range of sources and not from reports on monitoring activities carried out be CPs. Again, nesting data are more prevalent, and this time highlight the expansion of nesting to new areas. Detailed information on marine habitat use remains patchy but turtle presence can be assumed unless proven to the contrary.
Gaps
1055. As indicated, at-sea monitoring data are lacking which is largely a result of lack of consistent standardised monitoring turtles in marine habitats. Data on nesting populations are more common but are irregularly reported and lacking from certain established nesting areas.
Key results for CI 4
1056. With the recent publication of the marine habitat abundance map (Fig. 5) there is now a region-level assessment for marine turtles that can be used as a framework for estimating abundance. Nesting levels are stable or increasing at all major nesting sites where recent data have been reported and nesting is occurring where there was previously none.
Comparison
1057. Progress has been made towards better understanding of turtle population abundances since the previous report, through modelling at-sea populations using extensive transect datasets and from intensive beach-based fieldwork at nesting sites. However, the need for counts of males at breeding areas has only partially been met with very few studies, and monitoring programs at foraging, wintering and development grounds are still lacking.
Gaps
1058. There is still a lack of standardised monitoring across many nesting areas to determine population abundances present per Contracting Party and where there are programmes, reporting of required data is lacking. The situation is worse for in-water studies on turtle abundance as they are almost entirely lacking and those that are undertaken are not reported.
Key results for CI 5
1059. At the breeding areas, available data suggest that hatchling sex ratios are in favourable condition with sufficient males produced to sustain the populations. Lack of information on hatchling emergence success means annual recruitment cannot be determined, but given the generally increasing nesting populations, it suggests that over the long-term, sufficient hatchlings are being recruiting and surviving through to adulthood. Data on survival rates, threats at sea and other factors are very patchy, precluding any firm analysis, but again, given the general increase in breeding levels across the region there is expectation that populations are in suitable condition to be maintained and potentially increase further. However, direct evidence to support positive outlook are urgently required.
Comparison
1060. As was found with the 2017 assessment, present knowledge on sea turtle demography remains patchy, with certain information more widely available than others, and certain locations generating a disproportionate amount of relevant information. This situation needs to be improved to more robustly support the positive outlook for turtle populations suggested here, and to build population models that can predict which conservation actions should be prioritised to maintain and improve population status.
Gaps
1061. Fundamental monitoring and reporting gaps on the factors that can be influenced to improve the conservation status of sea turtles remain for all Contracting Parties as there are no standardised national monitoring and reporting regimes in place. Data on other topics relating to turtle nesting biology and fecundity lack consistent reporting and estimates of health, survivorship and population structure at sea are similarly lacking due to fundamental absence in relevant monitoring programs.
Measures and actions required to achieve GES (CIs 3, 4 and 5 for Marine Turtles)
1062. Despite this appraisal suggesting overall that GES is met for the marine turtle theme, many data that may support or refute this assessment are lacking and those data that are available have been retrieved from a wide range of sources, from primary scientific literature to unpublished reports and web articles. Consequently, the assessment has necessarily included inferences from expert opinion on various topics where a comprehensive synthesis of data is impossible due to lack of data or impractical due to patchy unstandardised datasets.
1063. Research (Table 8) and conservation (Table 9) priorities set out by Casale et al. (2018) remain relevant for better understanding of turtle populations and improving their conservation status and strongly concur with the requirements elaborated for the marine turtle assessment under IMAP (UNEP/MED WG.514/Inf.12, 2021). The competent authority in each CP needs to understand the data reporting requirements and which entity is undertaking specific monitoring actions. Through doing this it can identify gaps in data acquisition resulting from lack of fieldwork in necessary sites, gaps in reporting at sites where monitoring is carried out and identify entities that could be tasked with additional field monitoring at currently unmonitored sites. In terms of progressing towards adequate reporting, the simplest first step to take is to ensure data from all existing monitoring programmes are collected and reported in a standardised manner. The next most simple change is that in locations where monitoring programs exist, but collection of certain data is lacking, the programs should be adapted to acquire this sought-after information and analyse and report it as required.
1064. Challenges within each nation include knowledge of what work is being carried out where and by whom and do these actions then cover the full requirements of IMAP? Some countries have different entities working in different regions or on different fields (e.g., at-sea work or nesting beach studies etc.) but a national overview is lacking. It is therefore beneficial that each CP has in place some oversight or coordination mechanism to ensure all required monitoring activities are carried out. The coordinator could be a governmental body, scientific institution, or non-governmental organisation, with the important remit that they know what work is being carried out and have the competency to collect and synthesise the information adequately for each six-yearly Mediterranean Quality Status Report.
1065. This IMAP reporting framework, a requirement of all riparian Mediterranean states does not exist in isolation but coincides with other international reporting requirements such as those for the EU Habitats Directive and its Marine Strategy Framework Directive (MSFD). There is much overlap and synergy between these programs, which means data collected if collected in adequately rigorous manner can be used multiple times and not only for the IMAP. Of note is the recently published article highlighting progress towards a common approach for assessing marine turtle population status at European level within the MSFD, which should be considered when designing and coordinating marine turtle monitoring strategies. The resulting economy of scale lessens the burden on competent authorities as suitable coordinated actions obviate the need to repeat work and simplifies the analysis process.
Common Indicators 3, 4 and 5 (Cetaceans)
1066. The Mediterranean Sea harbours altogether 25 species and subspecies of cetaceans (dolphins, whales, porpoises), including 11 regular, three visitor and 11 vagrant species and subspecies (ACCOBAMS, 2021a) (Table 2.1). The presence and distribution of cetaceans is known to be a result of combination of environmental features, (i.e., physicochemical, climatological and geomorphological characteristics), biotic factors (i.e., prey distribution, predation, behavioural changes) and presence, spatial distribution and intensity of anthropogenic activities (Azzellino et al, 2007). In the Mediterranean Sea, the greatest species diversity is recorded in the Western Mediterranean sub-region.
Table 38: Cetacean species and subspecies occurring in the Mediterranean Sea. Based on: ACCOBAMS, 2021a and ACCOBAMS Resolution 8.12, 2022)

* Mediterranean Sub-regions: WMS – Western Mediterranean Sea; AS – Adriatic Sea; ICM – Ionian and Central Mediterranean; ALS – Aegean and Levantine Seas
** ACCOBAMS Resolution 8.12, 2022
Key messages (Cetaceans)
1067. The Mediterranean Sea harbours 25 cetaceans’ species, which are subjects to various human pressures, which reflects on their conservation status.
1068. At the present moment, it is not possible to assess whether cetaceans’ populations achieved Good Environmental Status (GES) under the EcAp/IMAP framework, since baseline/reference values for the GES assessment were only recently defined. However, the 2018 – 2021 IUCN Red-List Assessment shows that the most of cetacean populations in the Mediterranean Sea are significantly threatened, apart from the wide-spread species, such as common bottlenose dolphin (Tursiops truncatus) and striped dolphin (Stenella coeruleoalba), the status of which has improved since mid-2000.
1069. In order to improve the current status of cetaceans in the Mediterranean, conservation efforts invested thus far should be intensified and be based on good cooperation between different sectors.
1070. More emphasis should be given to the implementation of the existing conservation tools, such as guidelines for mitigation of certain pressures, best practices and spatial protection mechanisms, adopted under regional agreements; notably ACCOBAMS, the Barcelona Convention and GFCM.
Good environmental status (GES) assessment (CIs 3, 4 and 5 for Cetaceans)
Assessment methodology for CI3, CI4 and CI5 of EO1 regarding Cetaceans
The assessment of the state of cetaceans (GES assessment) under EcAp/IMAP EO1, is foremostly focused on the three common Indicators (CI): CI3 – Species distribution, CI4 – Population abundance and CI5 – Population demographic characteristics. The methodological approach to GES assessment takes stock of the methodological work for cetaceans performed under IMAP, particularly Document UNEP/MED WG.514/Inf.11 “Monitoring and Assessment Scales, Assessment Criteria, Thresholds and Baseline Values for the IMAP Common Indicators 3, 4 and 5 related to marine mammals” (UNEP, 2021). The Decision IG.21/3 2013 defines operational objectives and describes what is GES for each CI, and 2017 Common Indicator Guidance Facts Sheets (Biodiversity and Fisheries) (IMAP 2017) elaborates in more detail GES targets. Furthermore, according to the UNEP/MAP (2021), assessment of CI3 and CI4 is focused on eight representative species; one baleen whale (Mysticeti), two deep-diving toothed whales (Odnonceti) and five shallow-diving toothed whales (Odonoceti).
Alternative assessment for EO1 (CI3 and CI4 topics) – IUCN Red List assessment
The Red listing system of the IUCN is one of the most recognized methods for assessing and understanding the state of biodiversity. The IUCN criteria focus both on changes of population size and abundance over time (Criteria A), as well as changes of size and quality of species habitat (Criteria B), and related pressures, and as such these criteria co-relate with GES Common Indicators. Indeed, thresholds for the CI4 – Population abundance are based on the IUCN criteria on population size changes. Therefore, the results of the assessments of the status of cetaceans in the Mediterranean using IUCN criteria, represent good indicators of the state of cetaceans in this region.
Common Indicator 3: Species Distributional Range (Cetaceans)
1071. Long-finned pilot whale is a cetacean species found in a variety of deep-water environments, including offshore areas, canyons, and seamounts (Cañadas et al. 2005, Azzellino et al. 2008). It is one of the deepest-diving delphinids distributed almost exclusively in the deep pelagic waters of the western basin of the Mediterranean Sea (Verborgh et al., 2016, ACCOBAMS, 2021a) (Figure 60). Largest groups of long finned pilot whales were sighted in the Alborán Sea, along the coast of Morocco and in the Gulf Lion. Relatively smaller pods were observed in the Ligurian Sea within the waters of the Pelagos Sanctuary (ACCOBAMS, 2021a). Based on the 2018 – 2021 IUCN Red List assessment in ACCOBAMS area, long-finned pilot whale is listed as Endangered for the Inner Mediterranean subpopulation and Critically Endangered for the Strait of Gibraltar subpopulation.

Figure 60: Distribution of long-finned pilot whale (Globicephala melas) in the Mediterranean Sea. Source: ACCOBAMS, 2021a
1072. The distribution map shown in Figure 60 is based on experts’ interpretation of data from various data sources, with emphasis on ACCOBAMS Survey Initiative data. Since data is the main ingredient for GES assessment, a snapshot is given of various relevant/reliable data sources (databases) with the description of the number of available occurrence data, as data indicative for species distribution (Table 4.2.). It should be emphasized that data given in following paragraphs are indicative only and should be viewed as a contribution to the actual species distribution map given in Figure 60.
1073. A snapshot of occurrence data collected through OBIS, ASI data, GBIF, INTERCET and consolidations over 1100 records of the long-finned pilot whale occurrences over the time range from 1973 to 2021. In addition, species distribution data (polygons) is available, as reported by Member States related to the Habitats Directive, Article 17 (Figure 61 and Figure 62). Observations’ data confirm the presence of the long-finned pilot whale almost exclusively in the western Mediterranean Sea, as presented in the distribution map in Figure 60.

Figure 61: Globicephala melas occurrence data from INTERCET Project.
Source: INTERCET Presentation map https://www.intercet.it/ (data accessed in December 2022/January 2023)

Figure 62: Globicephala melas occurrence data from OBIS (1973-2019), ASI (2018), GBIF (1986-2021) and datasets (2013-2018) from reporting in relation to Article 17 of EU Habitats Directive (Public version – Aug. 2020).
GES assessment conclusion (CI 3, Species Distributional Range for Globicephala melas)
1074. The baseline/reference distribution map for long-finned pilot whale in the Mediterranean is defined and it shows that this species is present in the western portion of the Mediterranean basin and absent elsewhere (ACCOBAMS, 2021a). However, in order to assess whether the GES is achieved, as expressed through the defined threshold, it is required to have information of trends in spatial distribution. Since the baseline/reference value dates from 2018 and 2019 (ASI results published in 2021), there is no long-term data series and GES could not be assessed. GES assessment should be possible in the future (for the next Med QSR), particularly since the next Mediterranean Sea basin wide survey (next ASI) is planned for 2024 – 2026 (ACCOBAMS Resolution 8.10, 2022).
Risso’s dolphin (Grampus griseus)
1075. Risso’s dolphin is present throughout the Mediterranean Sea, with the most frequent observations in the western part of the basin – the Alborán Sea, the Moroccan and Algerian waters and the Balearic Islands (Figure 63). Risso’s dolphins have also been frequently spotted in the southern part of the Adriatic Sea as well as the Ionian Sea and the deep Hellenic Trench. In the eastern Mediterranean sightings are usually low and the species is also encountered in mixed-species groups with striped dolphins and short-beaked common dolphins in the deep waters of the Gulf of Corinth (Frantzis and Herzing, 2002; Frantzis et al., 2003). In the Mediterranean region, Risso’s dolphins are typically found in deep offshore waters and often in large groups or pods. Based on the 2018 – 2021 IUCN Red List assessment in the ACCOBAMS area, Risso’s dolphin is listed as Endangered (ACCOBAMS Resolution 8.12, 2022).

Figure 63: Distribution of Risso’s dolphin (Grampus griseus) in the Mediterranean Sea. Source: ACCOBAMS, 2021a136
136
136 Note: The source of distribution maps (ACCOBAMS, 2021a) shows species distribution in the Mediterranean Sea and, when applicable, in the contiguous Atlantic area (as parts of ACCOBAMS area). However, the focus of this report is the Mediterranean Sea, which is supported with written description of distribution. This is also valid for presentations of cetacean distribution maps elaborated in following sections.
1076. The distribution map shown in Figure 63 is based on experts’ interpretation of data from various data sources, with emphasis on ACCOBAMS Survey Initiative data. Since data is the main ingredient for GES assessment, a snapshot is given of various relevant/reliable data sources (databases) with the description of the number of available occurrence data, as data indicative for species distribution (Table 4.3.). It should be emphasized that data given in following paragraphs are indicative only and should be viewed as a contribution to the actual species distribution map given in Figure 63.
1077. Available data sources provide Risso’s dolphins’ occurrence data as well as depiction of the distribution area based on the datasets from the Article 17 of the Habitats Directive (Table 4.3.). Collected data consolidates over 1140 records of the Risso’s dolphins’ occurrences over the time range from 1973 to 2020 (Figure 64 and Figure 65). Observations’ data confirm the presence of the Risso’s dolphin as presented in the distribution map, as shown in Figure 63.

Figure 64: Grampus griseus occurrence data from INTERCET Project.
Source: INTERCET Presentation map https://www.intercet.it/

Figure 65: Grampus griseus occurrence data from OBIS (1973-2020), ASI (2018), GBIF (1993- 2019) and datasets (2013-2018) from reporting in relation to Article 17 of EU Habitats Directive (Public version – Aug. 2020).
GES assessment conclusion (CI 3, Species Distributional Range for Grampus griseus)
1078. The baseline/reference distribution map for presence of Risso’s dolphin in the Mediterranean is defined and it shows presence of the species throughout the Mediterranean basin, with the highest density and regular observations in the Alboran and Balearic Sea, southern part of the Adriatic as well as the Ionian and Aegean Sea (ACCOBAMS, 2021a). However, in order to assess whether the GES is achieved, as expressed through the defined threshold, it is required to have information on trends in spatial distribution. Since the baseline/reference value dates from 2018 and 2019 (ASI results published in 2021), there is no long-term data series and GES could not be assessed. GES assessment should be possible in the future (for the next Med QSR), particularly since the next Mediterranean Sea basin wide survey (next ASI) is planned for 2024 – 2026 (ACCOBAMS Resolution 8.10, 2022).
Common bottlenose dolphin (Tursiops truncatus)
1079. Common bottlenose dolphins are regularly present and widely distributed across the Mediterranean Sea, mostly spotted in the continental shelf but also occurring in the deeper offshore waters throughout the region. Most recent aerial data showed a discontinued distribution of the common bottlenose dolphin from the Strait of Gibraltar to the area north of the Balearic Islands towards the Gulf of Lion, Corsica and northern Tyrrhenian Sea. They seem particularly abundant in the northern Adriatic Sea, in the Strait of Sicily and in the Aegean Sea (Figure 66). Based on the 2018 – 2021 IUCN Red List assessment in ACCOBAMS area, common bottlenose dolphin is listed as Least Concern for the Inner Mediterranean subpopulation and Critically Endangered for the Gulf of Ambracia subpopulation (ACCOBAMS Resolution 8.12, 2022)

Figure 66: Distribution of common bottlenose dolphin (Tursiops truncatus) in the Mediterranean Sea. Source: ACCOBAMS, 2021a
1080. The distribution map shown in Figure 66 is based on experts’ interpretation of data from various data sources, with emphasis on ACCOBAMS Survey Initiative data. Since data is the main ingredient for GES assessment, a snapshot is given of various relevant/reliable data sources (databases) with the description of the number of available occurrence data, as data indicative for species distribution (Table 4.4.). It should be emphasized that data given in following paragraphs are indicative only and should be viewed as a contribution to the actual species distribution map given in Figure 66.
1081. Available data sources provide common bottlenose dolphins’ occurrence data as well as depiction of the distribution area based on the datasets from the Article 17 of the Habitats Directive (Table 4.4.) Collected data consolidates almost 14000 records of the common bottlenose dolphins’ occurrences over the time range from 1972 to 2022 (Figure 67 and Figure 68). Observations’ data confirm the presence of the common bottlenose dolphin as presented in the distribution map, as shown in Figure 66.
Table 39: Common bottlenose dolphin (Tursiops truncatus) in the Mediterranean Sea occurrence and distribution data from the relevant data sources (data accessed in December 2022/January 2023)
|
Data source |
Time range |
Description |
|
OBIS – Ocean Biodiversity Information System Mapper |
1972 – 2022 |
4592 occurrences |
|
The ACCOBAMS Survey Initiative (ASI) data |
2018 |
178 occurrences (pod size from 1 – 181) |
|
GBIF – Global Biodiversity Information Facility |
1990 – 2021 |
1322 occurrences |
|
INTERCET |
NA |
7621 occurrences |
|
Conservation status of habitat types and species: datasets from Article 17, Habitats Directive 92/43/EEC reporting (2013-2018) – PUBLIC VERSION – Aug. 2020 |
2013 – 2018 |
species distribution data (10km grid cells) as reported by Member States |

Figure 67: Tursiops truncatus occurrence data from INTERCET Project.
Source: INTERCET Presentation map https://www.intercet.it/

Figure 68: Tursiops truncatus occurrence data from OBIS (1972-2022), ASI (2018), GBIF (1990-2021) and datasets (2013-2018) from reporting in relation to Article 17 of EU Habitats Directive (Public version – Aug. 2020).
GES assessment conclusion (CI 3, Species Distributional Range for Tursiops truncatus)
1082. The baseline/reference distribution map for presence of common bottlenose dolphin in the Mediterranean is defined and it shows that the species is confirmed throughout the entire Mediterranean basin, especially in the continental shelf (ACCOBAMS, 2021a). However, in order to assess whether the GES is achieved, as expressed through the defined threshold, it is required to have information on trends in spatial distribution. Since the baseline/reference value dates from 2018 and 2019 (ASI results published in 2021), there is no long-term data series and GES could not be assessed. GES assessment should be possible in the future (for the next Med QSR), particularly since the next Mediterranean Sea basin wide survey (next ASI) is planned for 2024 – 2026 (ACCOBAMS Resolution 8.10, 2022).
Common dolphin (Delphinus delphis)
1083. Common bottlenose dolphins are regularly present and widely distributed across the Mediterranean Sea, mostly spotted in the continental shelf but also occurring in the deeper offshore waters throughout the region. Most recent aerial data showed a discontinued distribution of the common bottlenose dolphin from the Strait of Gibraltar to the area north of the Balearic Islands towards the Gulf of Lion, Corsica and northern Tyrrhenian Sea. They seem particularly abundant in the northern Adriatic Sea, in the Strait of Sicily and in the Aegean Sea (Figure 66). Based on the 2018 – 2021 IUCN Red List assessment in ACCOBAMS area, common bottlenose dolphin is listed as Least Concern for the Inner Mediterranean subpopulation and Critically Endangered for the Gulf of Ambracia subpopulation (ACCOBAMS Resolution 8.12, 2022)

Figure 69: Distribution of common dolphin (Delphinus delphis) in the Mediterranean Sea. Source: ACCOBAMS, 2021b
1084. The distribution map shown in Figure 69. is based on experts’ interpretation of data from various data sources, with emphasis on ACCOBAMS Survey Initiative data. Since data is the main ingredient for GES assessment, a snapshot is given of various relevant/reliable data sources (databases) with the description of the number of available occurrence data, as data indicative for species distribution (Table 4.5.). It should be emphasized that data given in following paragraphs are indicative only and should be viewed as a contribution to the actual species distribution map given in Figure 69.
1085. Available data sources provide common bottlenose dolphins’ occurrence data as well as depiction of the distribution area based on the datasets from the Article 17 of the Habitats Directive (Table 4.5). Collected data consolidates almost 3100 records of the common dolphins’ occurrences over the time range from 1934 to 2021 (Figure 70 and Figure 71). Observations’ data confirm the presence of the common dolphin as presented in the distribution map (Figure 4.14).

Figure 70: Delphinus delphis occurrence data from INTERCET Project.
Source: INTERCET Presentation map https://www.intercet.it/

Figure 71: Delphinus delphis occurrence data from OBIS (1969-2019), ASI (2018), GBIF (1934-2021) and datasets (2013-2018) from reporting in relation to Article 17 of EU Habitats Directive (Public version – Aug. 2020).
GES assessment conclusion (CI 3, Species Distributional Range for Delphinus delphis)
1086. The presence of common dolphin in the Mediterranean is confirmed mostly in the western part of Mediterranean basin, including Alboran Sea, around Sardinia and Sicily but also around the coast of North Africa as well as throughout Aegean Sea (ACCOBAMS, 2021a). However, in order to assess whether the GES is achieved, as expressed through the defined threshold, it is required to have information on trends in spatial distribution. Since the baseline/reference value dates from 2018 and 2019 (ASI results published in 2021), there is no long-term data series and GES could not be assessed. GES assessment should be possible in the future (for the next Med QSR), particularly since the next Mediterranean Sea basin wide survey (next ASI) is planned for 2024 – 2026 (ACCOBAMS Resolution 8.10, 2022).
Striped dolphin (Stenella coeruleoalba)
1087. Striped dolphin is the most sighted and abundant small cetacean species regularly present almost throughout the Mediterranean Sea where the can be found predominantly offshore and very rarely in waters shallower than 100 m (Notarbartolo di Sciara et al. 1993). It has also been regularly spotted from Gibraltar to the Levantine Sea, most often in the Alborán Sea region, in the waters between the Balearic Islands and the Iberian mainland, in the Gulf of Lions and in the Ligurian Sea as well as the Tyrrhenian and Ionian Seas, including in the Gulf of Taranto, and in the open waters of the southern Adriatic Sea, as well as in the Strait of Sicily, and throughout the Aegean and Levantine seas, all the way to Cyprus, Gulf of Corinth and Israel (Figure 69). Based on the 2018 – 2021 IUCN Red List assessment in ACCOBAMS area, striped dolphin is listed as Least Concern for the Mediterranean subpopulation and Endangered for the Gulf of Corinth subpopulation (ACCOBAMS Resolution 8.12, 2022).

Figure 72: Distribution of Striped dolphin (Stenella coeruleoalba) in the Mediterranean Sea. Source: ACCOBAMS, 2021a
1088. The distribution map shown in Figure 72. is based on experts’ interpretation of data from various data sources, with emphasis on ACCOBAMS Survey Initiative data. Since data is the main ingredient for GES assessment, a snapshot is given of various relevant/reliable data sources (databases) with the description of the number of available occurrence data, as data indicative for species distribution (Table 4.6.). It should be emphasized that data given in following paragraphs are indicative only and should be viewed as a contribution to the actual species distribution map given in Figure 72.
1089. Available data sources provide striped dolphins’ occurrence data as well as depiction of the distribution area based on the datasets from the Article 17 of the Habitats Directive (Table 4.6.). Collected data consolidates almost 25000 records of the striped dolphins’ occurrences over the time range from 1972 to 2021 (Figure 73 and Figure 74). Observations’ data confirm the presence of the striped dolphin as presented in the distribution map (Figure 72).

Figure 73: Stenella coeruleoalba occurrence data from INTERCET Project.
Source: INTERCET Presentation map https://www.intercet.it/

Figure 74: Stenella coeruleoalba occurrence data from OBIS (1972-2021), ASI (2018), GBIF (1996-2021) and datasets (2013-2018) from reporting in relation to Article 17 of EU Habitats Directive Public version – Aug. 2020.
GES assessment conclusion (CI 3, Species Distributional Range for Stenella coeruleoalba)
1090. The presence of the striped dolphin is confirmed throughout deeper waters of the entire Mediterranean basin, from Gibraltar to Levantine Sea. However, in order to assess whether the GES is achieved, as expressed through the defined threshold, it is required to have information on trends in spatial distribution. Since the baseline/reference value dates from 2018 and 2019 (ASI results published in 2021), there is no long-term data series and GES could not be assessed. GES assessment should be possible in the future (for the next Med QSR), particularly since the next Mediterranean Sea basin wide survey (next ASI) is planned for 2024 – 2026 (ACCOBAMS Resolution 8.10, 2022).
Sperm whale (Physeter macrocephalus)
1091. Sperm whale is a large cetacean species occurring throughout the deep and slope waters of the Mediterranean Sea, from Gibraltar to the Levantine Sea. Sperm whales have been most frequently spotted in specific areas such as the Strait of Gibraltar as well as in Tunisian waters, Balearic Islands, the Liguro-Provençal Basin, parts of the Tyrrhenian Sea, the Hellenic Trench, and south of Türkiye from Rhodes to Cyprus. Additionally, strandings have been reported in Libya and Egypt, suggesting intermittent use of this area by the species. Sperm whales are rare and occur only sporadically in the shallow waters of the Mediterranean such as the northern and central Adriatic, the Strait of Sicily and portions of the Aegean Sea, as shown in Figure 75. Based on the 2018 – 2021 IUCN Red List assessment in ACCOBAMS area, Mediterranean subpopulation of sperm whale is listed as Endangered (ACCOBAMS Resolution 8.12, 2022).

Figure 75: Distribution of Sperm whale (Physeter macrocephalus) in the Mediterranean Sea. Source: ACCOBAMS, 2021a
1092. The distribution map shown in Figure 75 is based on experts’ interpretation of data from various data sources, with emphasis on ACCOBAMS Survey Initiative data. Since data is the main ingredient for GES assessment, a snapshot is given of various relevant/reliable data sources (databases) with the description of the number of available occurrence data, as data indicative for species distribution (Table 4.7.). It should be emphasized that data given in following paragraphs are indicative only and should be viewed as a contribution to the actual species distribution map given in Figure 75.
1093. Available data sources provide sperm whales’ occurrence data as well as depiction of the distribution area based on the datasets from the Article 17 of the Habitats Directive (Table 4.7.). Collected data consolidates around 3200 records of the Sperm whales’ occurrences over the time range from 1913 to 2020 (Figure 76 and Figure 77). Observations’ data confirm the presence of the Sperm whales as presented in the distribution map (Figure 75).

Figure 76: Physeter macrocephalus occurrence data from INTERCET Project.
Source: INTERCET Presentation map https://www.intercet.it/

Figure 77: Physeter macrocephalus occurrence data from OBIS (1913-2020), ASI (2018), GBIF (1993-2013) and datasets (2013-2018) from reporting in relation to Article 17 of EU Habitats Directive Public version – Aug. 2020.
GES assessment conclusion (CI 3, Species Distributional Range for Physeter macrocephalus)
1094. The presence of the sperm whale is confirmed throughout deep offshore waters of the Mediterranean, with only sporadic seasonal occurrences in the shallow waters such as the northern and central Adriatic, the Strait of Sicily and portions of the Aegean Sea. However, in order to assess whether the GES is achieved, as expressed through the defined threshold, it is required to have information on trends in spatial distribution. Since the baseline/reference value dates from 2018 and 2019 (ASI results published in 2021), there is no long-term data series and GES could not be assessed. GES assessment should be possible in the future (for the next Med QSR), particularly since the next Mediterranean Sea basin wide survey (next ASI) is planned for 2024 – 2026 (ACCOBAMS Resolution 8.10, 2022).
Cuvier’s beaked whale (Ziphius cavirostris)
1095. Cuvier’s beaked whales are present throughout the Mediterranean basin, most abundantly in the following hotspots: the Alborán Sea, the northern part of Ligurian Sea, the northern Tyrrhenian Sea, the Ionian Sea (east of Sicily), narrow pathway from the southern Adriatic Sea, along the Hellenic Trench to the west of Cyprus and Levantine Sea waters off Lebanon and Israel. The species is rare or absent in the north and central Adriatic Sea as well as the Turkish Strait System, as shown in Figure 78. Cuvier’s beaked whale is also considered to be absent from the southern Mediterranean region, along the coast of Tunisia, Libya and Egypt, but this area is yet to be better investigated and monitored in order to make any conclusions. Based on the 2018 – 2021 IUCN Red List assessment in ACCOBAMS area, Mediterranean subpopulation of Cuvier’s beaked whale is listed as Vulnerable (ACCOBAMS Resolution 8.12, 2022).

Figure 78: Distribution of Cuvier’s beaked whale (Ziphius cavirostris) in the Mediterranean Sea. Source: ACCOBAMS, 2021a
1096. The distribution map shown in Figure 78 is based on experts’ interpretation of data from various data sources, with emphasis on ACCOBAMS Survey Initiative data. Since data is the main ingredient for GES assessment, a snapshot is given of various relevant/reliable data sources (databases) with the description of the number of available occurrence data, as data indicative for species distribution (Table 4.8.). It should be emphasized that data given in following paragraphs are indicative only and should be viewed as a contribution to the actual species distribution map given in Figure 78.
1097. Available data sources provide Cuvier’s beaked whales’ occurrence data as well as depiction of the distribution area based on the datasets from the Article 17 of the Habitats Directive (Table 4.8.). Collected data consolidates almost 900 records of the Cuvier’s beaked whales’ occurrences over the time range from 1974 to 2020 (Figure 79 and Figure 80). Observations’ data confirm the presence of the Cuvier’s beaked whales as presented in the distribution map (Figure 78).

Figure 79: Ziphius cavirostris occurrence data from INTERCET Project.
Source: INTERCET Presentation map https://www.intercet.it/

Figure 80: Ziphius cavirostris occurrence data from OBIS (1974-2020), ASI (2018), GBIF (2002-2020) and datasets (2013-2018) from reporting in relation to Article 17 of EU Habitats Directive Public version – Aug. 2020.
GES assessment conclusion (CI 3, Species Distributional Range for Ziphius cavirostris)
1098. The presence of the Cuvier’s beaked whale is confirmed throughout the Mediterranean region, where they occur in relatively small patches at low densities in specific hotspots (such as Ionian Sea and the Hellenic Trench, southern Adriatic Sea, the Central Tyrrhenian Sea, the Balearic and the Alborán Seas). However, in order to assess whether the GES is achieved, as expressed through the defined threshold, it is required to have information on trends in spatial distribution. Since the reference value date from 2018 and 2019 (ASI results published in 2021), there is no long-term data series and GES could not be assessed. GES assessment should be possible in the future (for the next Med QSR), particularly since the next Mediterranean Sea basin wide survey (next ASI) is planned for 2024 – 2026 (ACCOBAMS Resolution 8.10, 2022).
Fin whale (Balaenoptera physalus)
1099. Fin whale is a large cetacean species regularly present in the deep, pelagic offshore waters of the western Mediterranean basin, with the highest occurrence in the Ligurian Sea, Gulf of Lions, Provençal Basin and the Western part of the Pelagos Sanctuary and less frequent elsewhere. It should be noted that the species is also present in the Gulf of Cadiz in contiguous Atlantic area, due to the importance of the seasonal migration of the species from Strait of Gibraltar and Gulf of Cadiz in the spring and summer, and back to the Mediterranean basin from November to March (ACCOBAMS; 2021a). During the summer time Fin whales are concentrating around their feeding grounds in the Provencal, Corsican, Ligurian and northern Tyrrhenian seas (Notarbartolo di Sciara et al. 2003), as well as the Strait of Sicily in winter (Canese et al. 2006), in the Balearic Sea in spring (EDMAKTUB 2018). It occurs only sporadically in the northern part of the Adriatic, Aegean and Levantine seas (Notarbartolo di Sciara et al. 2003), as shown in Figure 81. Based on the 2018 – 2021 IUCN Red List assessment in ACCOBAMS area, Mediterranean subpopulation of fin whale is listed as Endangered (ACCOBAMS Resolution 8.12, 2022).

Figure 81: Distribution of Fin whale (Balaenoptera physalus) in the Mediterranean Sea. Source: ACCOBAMS, 2021a
1100. The distribution map shown in Figure 81 is based on experts’ interpretation of data from various data sources, with emphasis on ACCOBAMS Survey Initiative data. Since data is the main ingredient for GES assessment, a snapshot is given of various relevant/reliable data sources (databases) with the description of the number of available occurrence data, as data indicative for species distribution (Table 4.9.). It should be emphasized that data given in following paragraphs are indicative only and should be viewed as a contribution to the actual species distribution map given in Figure 81.
1101. Available data sources provide fin whales’ occurrence data as well as depiction of the distribution area based on the datasets from the Article 17 of the Habitats Directive (Table 4.9.). Collected data consolidates almost 5800 records of the Fin whales’ occurrences over the time range from 1934 to 2021 (Figure 82 and Figure 83). Observations’ data confirm the presence of the Fin whales as presented in the distribution map (Figure 81).

Figure 82: Balaenoptera physalus occurrence data from INTERCET Project.
Source: INTERCET Presentation map https://www.intercet.it/

Figure 83: Balaenoptera physalus occurrence data from OBIS (1974-2020), ASI (2018), GBIF (2002-2020) and datasets (2013-2018) from reporting in relation to Article 17 of EU Habitats Directive Public version – Aug. 2020.
GES assessment conclusion (CI 3, Species Distributional Range for Balaenoptera physalus)
1102. The presence of the fin whale is confirmed throughout deep offshore waters of the western and central Mediterranean basin, with only sporadic seasonal occurrences elsewhere. However, in order to assess whether the GES is achieved, as expressed through the defined threshold, it is required to have information on trends in spatial distribution. Since the baseline/reference value dates from 2018 and 2019 (ASI results published in 2021), there is no long-term data series and GES could not be assessed. GES assessment should be possible in the future (for the next Med QSR), particularly since the next Mediterranean Sea basin wide survey (next ASI) is planned for 2024 – 2026 (ACCOBAMS Resolution 8.10, 2022).
Table 40: Assessment of GES for Cetaceans in the Mediterranean Sea for CI3 - Species distribution, based on selected species
| Common Indicator | GES definition |
GES Assessment Globicephala melas – Long finned pilot whale; Grampus griseus – Risso’s dolphin; Tursiops truncatus – common bottlenose dolphin; Delphinus delphis – common dolphin; Stenella coeruleoalba – striped dolphin; Balaenoptera physalus – fin whale; Physeter macrocephalus – sperm whale; Ziphius cavirostris – Cuvier’s beaked whale |
| CI3 Species distributional range | The species are present in all their natural distributional range. |
Not possible to assess GES. Namely, the baseline/reference values for CI3, expressed through species distributional maps, are set only recently; with ASI survey actually being carried out in 2018 and 2019 and results published in 2021 and the overview of the state of cetaceans in ACCOBAMS area based on all available data (including ASI and other research), compiled in 2021 (ACCOBAMS, 2021a). However, there is no long-term data series needed to measure whether defined thresholds are achieved. GES assessment should be possible in the future (for the next Med QSR), particularly since the next Mediterranean Sea basin wide survey (ASI 2) is planned for 2024 -2026. |
Common Indicator 4: Population Abundance (Cetaceans)
Long finned pilot whale (Globicephala melas)
1103. Long-finned pilot whales prefer deep pelagic waters of the western Mediterranean Sea with largest groups observed in the Alborán Sea, along the coast of Morocco and in the Gulf Lion and smaller pods observed in the Pelagos Sanctuary (Figure 84). The species’ overall abundance is estimated at 5130 individuals on the Mediterranean level. On the sub-regional level, abundance is estimated as follows: Western Mediterranean Sea 4833, Ionian Sea and the Central Mediterranean Sea 297, Adriatic Sea 0 and Aegean – Levantine Sea 0 (ACCOBAMS, 2021b).
1104. During ASI 2018/2019, 14 long-finned pilot whales’ observations were registered with pod sizes ranging from 1 – 30. It should be noted that pilot whales are to some extent difficult to spot during aerial surveys due to the relatively short surfacing periods (Thomson et al., 2012). Hence the abundance and density estimates derived from aerial surveys should be considered with caution.
1105. Based on the 2018 – 2021 IUCN Red List assessment in the ACCOBAMS area, long- finned pilot whale is listed as Endangered for the Inner Mediterranean subpopulation and Critically Endangered for the Strait of Gibraltar subpopulation (ACCOBAMS Resolution 8.12, 2022).

Figure 84: Long finned pilot whale (Globicephala melas) observations by pod size (Prepared using ASI 2018/2019 data).
GES assessment conclusion (CI 4, Population Abundance for Globicephala melas)
1106. Long- finned pilot whale population abundance has been estimated based on the data collected through ASI 2018/2019, thus providing baseline/reference values for CI4 common indicator. However, in order to assess GES, it is required to examine potential changes in population abundance levels; that is population abundance trends. Since the baseline/reference values date from 2018 and 2019 (ASI results published in 2021), there is no long-term data series and GES could not be assessed. GES assessment should be possible in the future (for the next Med QSR), particularly since the next Mediterranean Sea basin wide survey (next ASI) is planned for 2024 – 2026 (ACCOBAMS Resolution 8.10, 2022). In addition, in the scope of ACCOBAMS and in cooperation with IUCN, a revised IUCN conservation status assessment will be carried out in the future.
Risso’s dolphin (Grampus griseus)
1107. Available observation data confirms Risso’s dolphins’ strong preference for the western basin of the Mediterranean Sea in summer, with highest abundance and density registered in the Alborán Sea, the Moroccan and Algerian waters and the Balearic Islands. Relatively large groups of Risso’s dolphins have also been spotted in the deeper southern part of the Adriatic Sea, the Ionian Sea and the deep Hellenic Trench (Figure 85, Figure 86). During ASI 2018/2019 64 Risso’s dolphins’ observations were registered with pod sizes ranging from 1 – 40. Estimated species’ overall abundance is 23164. On the sub-regional level, abundance is estimated as follows: Western Mediterranean Sea 16651, Ionian Sea and the Central Mediterranean Sea 1540, Adriatic Sea 1467 and Aegean – Levantine Sea 3506.
1108. Based on the 2018 – 2021 IUCN Red List assessment in the ACCOBAMS area, Risso’s dolphin is listed as Endangered (ACCOBAMS Resolution 8.12, 2022).

Figure 85: Encounter rate of Risso’s dolphins (sightings per km) on a grid of 100×100 km. Source: ACCOBAMS, 2021b.

Figure 86: Predicted abundance of Risso’s dolphins (Grampus griseus).
Source: ACCOBAMS, 2021b.
GES assessment conclusion (CI 4, Population Abundance for Grampus griseus)
1109. Risso’s dolphin population abundance has been estimated based on the data collected through ASI 2018/2019, thus providing baseline/reference values for CI4 common indicator. However, in order to assess GES, it is required to examine potential changes in population abundance levels; that is population abundance trends. Since the baseline/reference values date from 2018 and 2019 (ASI results published in 2021), there is no long-term data series and GES could not be assessed. GES assessment should be possible in the future (for the next Med QSR), particularly since the next Mediterranean Sea basin wide survey (next ASI) is planned for 2024 – 2026 (ACCOBAMS Resolution 8.10, 2022). In addition, in the scope of ACCOBAMS and in cooperation with IUCN, a revised IUCN conservation status assessment will be carried out in the future.
Common bottlenose dolphin (Tursiops truncatus)
1110. Common bottlenose dolphin is the second most abundant species mostly observed in coastal areas during the latest aerial survey ASI 2018/2019. Species distribution was strongly fragmented with patches of higher abundance in the Strait of Gibraltar and Alborán Sea, the Balearic Sea and the Gulf of Lion, the waters surrounding the Island of Corsica and north of Tyrrhenian Sea. Common bottlenose dolphins appeared regularly in the northern Adriatic Sea, in the Strait of Sicily and in the Aegean Sea (Figure 85).
1111. During ASI 2018/2019 178 common bottlenose dolphins’ observations were registered with pod sizes ranging from 1 to 181 (Figure 86). Estimated species’ overall abundance is 61391. On the sub-regional level, abundance is estimated as follows: Western Mediterranean Sea 23363, Ionian Sea and the Central Mediterranean Sea 16010, Adriatic Sea 10350 and Aegean – Levantine Sea 11669.
1112. On the IUCN Red List assessment in the ACCOBAMS area, Tursiops truncatus is listed as Least Concern for the Inner Mediterranean subpopulation and Critically Endangered for the Gulf of Ambracia subpopulation (ACCOBAMS Resolution 8.12, 2022).

Figure 87: Encounter rate of common bottlenose dolphins (sightings per km) on a grid of 100×100 km. Source: ACCOBAMS, 2021b.

Figure 88: Predicted abundance of common bottlenose dolphins (Tursiops truncatus). Source: ACCOBAMS, 2021b
GES assessment conclusion (CI 4, Population Abundance for Tursiops truncatus)
1113. Common bottlenose dolphin population abundance has been estimated based on the data collected through ACCOBAMS Aerial Survey (ASI) 2018, thus providing baseline/reference values for CI4 common indicator. However, in order to assess GES, it is required to examine potential changes in population abundance levels; that is population abundance trends. Since the baseline/reference values date from 2018 and 2019 (ASI results published in 2021), there is no long-term data series and GES could not be assessed. GES assessment should be possible in the future (for the next Med QSR), particularly since the next Mediterranean Sea basin wide survey (next ASI) is planned for 2024 – 2026 (ACCOBAMS Resolution 8.10, 2022). In addition, in the scope of ACCOBAMS and in cooperation with IUCN, a revised IUCN conservation status assessment will be carried out in the future.
Common dolphin (Delphinus delphis)
1114. Common dolphins have been mostly sighted in the Western portion of the Mediterranean basin, with the highest encounter rates in the Tyrrhenian Sea and the Strait of Sicily (Figure 89). During the ASI 2018/2019 aerial survey the common dolphins were sighted usually in mixed- species groups with striped dolphins, often resulting in unclear species identification. Sightings identified as common dolphins were only 32 with pod sizes ranging from 1 – 150 (without striped/common dolphin undistinguished observations) (Figure 90, Figure 91). The overall abundance for the Mediterranean was estimated at 29647. On the sub-regional level, abundance is estimated as follows: Western Mediterranean Sea 24430, Ionian Sea and the Central Mediterranean Sea 1214, Adriatic Sea 0 and Aegean – Levantine Sea 4003. Based on the 2018 – 2021 IUCN Red List assessment in the ACCOBAMS area, Delphinus delphis is listed as Endangered for the Inner Mediterranean subpopulation and Critically Endangered for the Gulf of Corinth subpopulation (ACCOBAMS Resolution 8.12, 2022).

Figure 89: Encounter rate of Striped and unidentified striped or common dolphins (sightings per km) on a grid of 50×50 km. Source: ACCOBAMS, 2021b.

Figure 90: Predicted abundance of undetermined striped or common dolphins. Source: ACCOBAMS, 2021b.

Figure 91: Predicted abundance of small dolphins (striped, common dolphins). Source: ACCOBAMS, 2021b.
GES assessment conclusion (CI 4, Population Abundance for Delphinus delphis)
1115. Common dolphin population abundance has been estimated based on the data collected through ASI 2018/2019, thus providing baseline/reference values for CI4 common indicator. However, in order to assess GES, it is required to examine potential changes in population abundance levels; that is population abundance trends. Since the baseline/reference values date from 2018 and 2019 (ASI results published in 2021), there is no long-term data series and GES could not be assessed. GES assessment should be possible in the future (for the next Med QSR), particularly since the next Mediterranean Sea basin wide survey (next ASI) is planned for 2024 – 2026 (ACCOBAMS Resolution 8.10, 2022). In addition, in the scope of ACCOBAMS and in cooperation with IUCN, a revised IUCN conservation status assessment will be carried out in the future.
Striped dolphin (Stenella coeruleoalba)
1116. Both aerial and vessel surveys resulted in the striped dolphin being the most sighted and abundant species in the Mediterranean, with a clear preference for the Western Basin (Figure 89). Striped dolphins were registered in 451 occurrences with pod sizes ranging from 1 – 250 (Figure 4.42). The overall abundance was estimated at about 419456 individuals. On the sub- regional level, abundance is estimated as follows: Western Mediterranean Sea 315789, Ionian Sea and the Central Mediterranean Sea 66311, Adriatic Sea 10264 and Aegean – Levantine Sea 27092.
1117. It is important to note that during the ASI survey the striped dolphins were commonly sighted within mixed-species groups with common dolphins, often resulting in unclear species identification imperfect species detection.
1118. Based on the 2018 – 2021 IUCN Red List assessment in the ACCOBAMS area, striped dolphin is listed as Least Concern for the Mediterranean subpopulation and Endangered for the Gulf of Corinth subpopulation (ACCOBAMS Resolution 8.12, 2022).

Figure 92: Predicted abundance of Striped dolphins. Source: ACCOBAMS, 2021b.
GES assessment conclusion (CI 4, Population Abundance for Stenella coeruleoalba)
1119. Striped dolphin population abundance has been estimated based on the data collected through ACCOBAMS Aerial Survey (ASI) 2018, thus providing baseline/reference values for CI4 common indicator. However, in order to assess GES, it is required to examine potential changes in population abundance levels; that is population abundance trends. Since the baseline/reference values date from 2018 and 2019 (ASI results published in 2021), there is no long-term data series and GES could not be assessed. GES assessment should be possible in the future (for the next Med QSR), particularly since the next Mediterranean Sea basin wide survey (next ASI) is planned for 2022 – 2026 (ACCOBAMS Resolution 8.10, 2022). In addition, in the scope of ACCOBAMS and in cooperation with IUCN, a revised IUCN conservation status assessment will be carried out in the future.
Sperm whale (Physeter macrocephalus)
1120. During ASI 2018/2019, sperm whales were detected acoustically throughout the western basin of the Mediterranean Sea, from Alboran to Tyrrhenian Sea, with additional detections in the Strait of Gibraltar (Figure 93). A total of 249 individual sperm whales were detected from Song of the Whale and additional 71 individuals were detected off the track-line (Error! Reference source not found.). The overall abundance of sperm whales was estimated at about 1416. On the sub-regional level, abundance is estimated as follows: Western Mediterranean Sea 356, Ionian Sea and the Central Mediterranean Sea 324, Adriatic Sea 0 and Aegean – Levantine Sea 737.
1121. Based on the 2018 – 2021 IUCN Red List assessment in the ACCOBAMS area, Mediterranean subpopulation of sperm-whale is listed as Endangered (ACCOBAMS Resolution 8.12, 2022).

Figure 93: Sightings and detections of sperm whales made by the Song of the Whale team during the ASI survey (white squares and red/orange circles respectively). A predicted density map from Mannocci et al., 2018b is overlaid showing regions of ideal sperm whale habitat (yellow = highest likelihood, blue = lowest likelihood). Source: ACCOBAMS, 2021b.

Figure 94: Sperm whale acoustic densities (individuals per 1000 km2) derived for each block surveyed by the Song of the Whale team. Empty blocks represent those areas where no on-track detections were made. Source: ACCOBAMS, 2021b.
GES assessment conclusion (CI 4, Population Abundance for Physeter macrocephalus)
1122. Sperm whale population abundance has been estimated based on the data collected through ACCOBAMS Aerial Survey (ASI) 2018/2019, thus providing baseline/reference values for CI4 common indicator. However, in order to assess GES, it is required to examine potential changes in population abundance levels; that is population abundance trends. Since the baseline/reference values date from 2018 and 2019 (ASI results published in 2021), there is no long-term data series and GES could not be assessed. GES assessment should be possible in the future (for the next Med QSR), particularly since the next Mediterranean Sea basin wide survey (next ASI) is planned for 2024 – 2026 (ACCOBAMS Resolution 8.10, 2022). In addition, in the scope of ACCOBAMS and in cooperation with IUCN, a revised IUCN conservation status assessment will be carried out in the future.
Cuvier’s beaked whale (Ziphius cavirostris)
1123. Cuvier’s beaked whale is a deep diver species sighted in the scope of ASI throughout Mediterranean regions, with highest abundance and encounter rates in specific hotspots such as the Alborán Sea, the northern part of Ligurian Sea, the northern Tyrrhenian Sea, the Ionian Sea (east of Sicily), narrow pathway from the southern Adriatic Sea, along the Hellenic Trench to the west of Cyprus and Levantine Sea waters off Lebanon and Israel (Figure 95, Figure 96). Cuvier’s beaked whales were spotted within 17 occurrences with pod sizes ranging from 1 – 10 individuals. The overall abundance for the Mediterranean was estimated at about 2724. On the sub-regional level, abundance is estimated as follows: Western Mediterranean Sea 1406, Ionian Sea and the Central Mediterranean Sea 616, Adriatic Sea 66 and Aegean – Levantine Sea 637. 1124. Based on the 2018 – 2021 IUCN Red List assessment in the ACCOBAMS area, Mediterranean subpopulation of Cuvier’s beaked whale is listed as Vulnerable (ACCOBAMS Resolution 8.12, 2022).

Figure 95: Encounter rate of deep divers (sightings per km): Kogia spp., sperm whales and Ziphiidea on a grid of 100×100 km and effort surveyed with sightings by species with class of pod size (a number of sightings by class) during aerial survey. Source: ACCOBAMS, 2021b.

Figure 96: Sightings/detections of beaked whales made by all survey vessels during the ASI survey (pink squares/circles respectively). A predicted density map from Cañadas et al., 2018 is overlaid in monochrome showing those regions likely to contain ideal habit for Cuvier’s beaked whale (the predictions in the striped region were considered unreliable due to low sample size). Source: ACCOBAMS, 2021b.
GES assessment conclusion (CI 4, Population Abundance for Ziphius cavirostris)
1125. Cuvier’s beaked whale population abundance has been estimated based on the data collected through ACCOBAMS Aerial Survey (ASI) 2018/2019, thus providing baseline/reference values for CI4 common indicator. However, in order to assess GES, it is required to examine potential changes in population abundance levels; that is population abundance trends. Since the baseline/reference values date from 2018 and 2019 (ASI results published in 2021), there is no long-term data series and GES could not be assessed. GES assessment should be possible in the future (for the next Med QSR), particularly since the next Mediterranean Sea basin wide survey (next ASI) is planned for 2024 – 2026 (ACCOBAMS Resolution 8.10). In addition, in the scope of ACCOBAMS and in cooperation with IUCN, a revised IUCN conservation status assessment will be carried out in the future.
Fin whales (Balaenoptera physalus)
1126. During ASI 2018/2019 aerial survey, fin whales were mostly sighted in the deep, offshore waters of the western Mediterranean basin, with the highest abundance in the Ligurian Sea, Gulf of Lions and Gulf of Cadiz, Provençal Basin and the Western part of the Pelagos Sanctuary. Species was spotted within 50 occurrences with pod sizes ranging from 1 – 4 individuals (Figure 97). The overall abundance in the Mediterranean was estimated at about 1960. On the sub- regional level, abundance is estimated as follows: Western Mediterranean Sea 1765, Ionian Sea and the Central Mediterranean Sea 195, Adriatic Sea 0 and Aegean – Levantine Sea 0.
1127. Based on the 2018 – 2021 IUCN Red List assessment in the ACCOBAMS area, Mediterranean subpopulation of Balaenoptera physalus is listed as Endangered (ACCOBAMS Resolution 8.12, 2022).

Figure 97: Predicted abundance of Fin whales. Source: ACCOBAMS, 2021b.
GES assessment conclusion (CI 4, Population Abundance for Balaenoptera physalus)
1128. Fin whale population abundance has been estimated based on the data collected through ASI 2018/2019, thus providing baseline/reference values for CI4 common indicator. However, in order to assess GES, it is required to examine potential changes in population abundance levels; that is population abundance trends. Since the baseline/reference values date from 2018 and 2019 (ASI results published in 2021), there is no long-term data series and GES could not be assessed. GES assessment should be possible in the future (for the next Med QSR), particularly since the next Mediterranean Sea basin wide survey (next ASI) is planned for 2024 – 2026 (ACCOBAMS Resolution 8.10, 2022). In addition, in the scope of ACCOBAMS and in cooperation with IUCN, a revised IUCN conservation status assessment will be carried out in the future.
Table 41: Assessment of GES for Cetaceans in the Mediterranean Sea for CI4, based on selected species
| Criteria Indicator | GES definition |
GES Assessment Globicephala melas – Long finned pilot whale; Grampus griseus – Risso’s dolphin; Tursiops truncatus – common bottlenose dolphin; Delphinus delphis – common dolphin; Stenella coeruleoalba – striped dolphin; Balaenoptera physalus – fin whale; Physeter macrocephalus – sperm whale; Ziphius cavirostris – Cuvier’s beaked whale |
| CI4 Population abundance |
The species population has abundance levels allowing qualification to Least Concern Category of IUCN Red List or has abundance levels that are improving and moving away from the more critical IUCN category. |
Not possible to assess GES. Namely, the regional baseline/reference values for CI4 are set only recently; with ASI survey actually being carried out in 2018 and 2019 and results published in 2021, and there is no long-term data series needed to measure whether defined thresholds are achieved. However, data for some species, notably long-finned pilot whale, should be taken with particular caution. GES assessment should be possible in the future (for the next Med QSR), particularly since the next Mediterranean Sea basin wide survey (ASI 2) is planned for 2024 -2026, and the IUCN Red List assessment for the ACCOBAMS area will also be revised. |
Common Indicator 5: Population Demographic Characteristics (Cetaceans)
1129. The Document UNEP/MED WG.514/Inf.11 “Monitoring and Assessment Scales, Assessment Criteria, Thresholds and Baseline Values for the IMAP Common Indicators 3, 4 and 5 related to marine mammals” (UNEP, 2021) proposes to move GES definitions for State and Pressures to CI12 and reformulate definition for CI5. So that it reflects better the population demographic characteristics such as sex ratio, calf production etc.
1130. Furthermore, methodologically, according to Document UNEP/MED WG.514/Inf.11, it is not possible to develop baseline/ reference and threshold values for the assessment of CI5, due to lack of data. Although there are various available data sources with cetacean bycatch and strandings data, this data is still partial, inconsistent and it is not possible to draw concrete conclusions about level of bycatch and other human impacts, and subsequently to which level these issues represent the problem for conservation of cetaceans.
1131. The GES assessment methodology in relation to cetaceans for CI5 should further developed with the view to elaborate and agree on options allowing to reflect the population demographic characteristics such as sex ratio, calf production etc.
Summary of GES assessment for CI3, CI4 and CI5
Table 42: GES assessment summary for CI3, CI4 and CI5 for representative cetacean species in the Mediterranean
|
EO1 Common Indicators |
CETACEAN SPECIES | |||||||
| Globice phala melas | Gram pus griseu s | Tursiop s truncatu s | Delphin us delphis | Stenella coeruleoal ba | Physeter macroceph alus | Ziphius cavirostri s | Balaenop tera physalus | |
| CI3 Species distributional range | ||||||||
| CI4 Population abundance | ||||||||
| CI5 Population demographic characteristics | X | X | X | X | X | |||
Colour scheme: Grey – GES not possible to assess; X – species not representative for specific CI
Summary of alternative assessment – IUCN Red List assessment
1132. Based on the results of the IUCN Red List assessments carried out in the scope of ACCOBAMS in the 2018 – 2021 period, and focussing on eight species that are representative for the GES assessment, it could be concluded that the state of cetaceans is not good (Table 4.25.). Still, when comparing the recent results with the mid-2000s assessment, there are some positive trends. Most notably, the status improved for common bottlenose dolphin and striped dolphin populations. In addition, thanks to the improved data, it was possible to assess the status of previously data deficient species, notably Cuvier’s beaked whale and long-finned pilot whale. However, for fin whale, the status has worsened.
Table 43: IUCN Red List assessments status comparison for cetacean species representative for the GES assessment

Summary of alternative assessment – IUCN Red List assessment
1133. The state of cetaceans, as measured through GES assessment under EO1, could be linked to majority of measured EOs under IMAP: EO3 (Fisheries), EO5 (Eutrophication), EO7 (Hydrographic characteristics), EO8 (physical loss of coastal ecosystems and landscapes), EO9 (Pollution) and E10 (marine litter). The relevance of EO11 (Underwater noise) for cetaceans should also be mentioned, even though the CIs under EO11 are not yet elaborated. In any case, due to limited knowledge, it is not yet fully possible to evaluate the significance of these interrelations. Further in the text, most relevant qualitative characteristics of interlinkages between EO1 for cetaceans and other EOs are summarised. It should also be noted that all EOs are very much interlinked between themselves.
1134. As already elaborated under Chapter 3, interactions with fisheries represent significant challenges for cetaceans, particularly through bycatch and loss of fish as cetaceans prey. The most concrete link between EO3 – Fisheries and measurements of GES for cetaceans under EO1 is EO3’s CI12, which measures bycatch of vulnerable and non-target species.
1135. Eutrophication (EO5) can have severe impacts on the entire marine ecosystem through nutrient and organic matter enrichment. As such, eutrophication can also be linked to fisheries and alternation of food webs, which can have consequences to cetaceans too. According to the available knowledge, eutrophication is not yet perceived as relevant for the cetaceans in the Mediterranean Sea.
1136. Hydrographic characteristics (EO7) (such as temperature, salinity, currents, waves, turbulence etc.) play a crucial role in the dynamics of marine ecosystems and are therefore interlinked with all other EOs. Changes of hydrographic characteristics are particularly linked to climate change, with the obvious example of more extreme sea temperatures occurring. These changes affect not only the habitats and entire food-chain, but they could facilitate spread of marine litter and redistribution of contaminants.
1137. The alternations of coastal ecosystems and landscapes (EO8), particularly urbanizations and all pressures on environment it entails, may also cause nutrient enrichment in near-shore marine areas, as well as bring pollutants (EO9), and as such, indirectly affect food-webs and higher trophic levels, such as cetaceans.
1138. Pollution (EO9) may also affect cetaceans. This could be demonstrated through toxicological effects of harmful chemicals and microbial pathogens.
1139. Marine litter (EO10) has certain impacts on cetaceans; such as causing suffocation through ingestion of plastic, and entanglement of animals in fishing gear. As already indicated, microplastic is also quite problematic, entering the food-web, starting with shellfish and fish and subsequently culminating in cetaceans. Recent research studies also show that chemical plasticizers and other known persistent substances can leach from marine litter (both macro and microlitter items). However, present knowledge on marine litter-cetaceans’ interactions at the Mediterranean Sea level is still not sufficient to draw more quantifiable conclusions.
Key findings per Common Indicator (CI3, CI4 and CI5 for Cetaceans)
CI3 – Species distribution
1140. The first methodological step in GES assessment for cetaceans has been made for CI3 – Species distribution under UNEP/MAP with definition of GES assessment criteria, particularly baseline/reference values and thresholds, as elaborated in the 21WG.514/Inf.11. However, quantification of measurement of changes in distribution, which will be relevant for the next Med QSR report, is not clear (for example, which measurement unit will be used to compare baseline/reference values with thresholds).
1141. The first regional level based synoptic survey of cetaceans, carried out in the scope of the ACCOBAMS Survey Initiative project (aerial and vessel boat surveys were carried out in 2018 and 2019, and data processed in 2021) acquired cetacean distribution data for most of the region (except for the parts of the southern Mediterranean – particularly its central and eastern section). Complemented with data from previous research on national and regional levels, baseline/reference values were determined, expressed through species distribution maps. Identification of baseline values is a significant improvement when compared to the Med QSR 2017.
1142. ACCOBAMS Survey Initiative project was a joint coordinated venture of international organisations, national institutions and cetacean expert, supported by the international and national funding, and this effort displays clearly the necessity of regional – national cooperation in monitoring and subsequently conservation of migratory species, such as cetaceans, in the Mediterranean.
1143. ASI results are available and accessible via web (including spatial GIS data). In addition, there are also other web-based data sources, which include, among all, occurrence data in spatial format, most notably OBIS, GBIF and INTERCET.
1144. Regional surveys, such as ASI, establish and represent an important effort to assess cetaceans’ distribution and monitor trends through a coordinated and standardised system.
1145. GES could not be assessed for the CI3, since the baseline/reference values are recently established (2018 – 2021), and there is no longer-time data series necessary for GES assessment. However, the next ASI project, planned in the scope of ACCOBAMS for 2024 – 2026 should contribute with a new set of data needed for the GES assessment in the scope of the next Med QSR report.
Knowledge gaps for CI3
1146. There is still a disparity in research effort, with the most significant gaps in the southern part of the Mediterranean, which was also shown during the implementation of the ASI project.
1147. Long-term data series are missing, which would be based on systematic monitoring. For the Med QSR 2023 report it is understandable, since the baseline/referent values for cetaceans are determined only recently (2018 – 2021).
1148. There is lack of more quantified thresholds for CI3
CI4 – Population abundance
1149. The same as for the CI3, the first methodological step in GES assessment for cetaceans has been made for CI4 – Population abundance under UNEP/MAP with definition of GES assessment criteria, particularly baseline/reference values and thresholds, as elaborated in the 21WG.514/Inf.11.
1150. The first regional level based synoptic survey of cetaceans, carried out in the scope of the ACCOBAMS Survey Initiative project (aerial and vessel boat surveys were carried out in 2018 and 2019, and data processed in 2021) acquired cetacean abundance data for the most of the region (except for the parts of the southern Mediterranean – particularly its central and eastern section) and baseline/reference values were determined at the Mediterranean regional level, with estimation being also done atof the level of 4 sub-regions, Western Mediterranean, Ionian and Central Mediterranean, Adriatic Sea, Aegean and Levantine Seas. Identification of baseline values is significant improvement when compared to the Med QSR 2017.
1151. ACCOBAMS Survey Initiative project was a joint coordinated venture of international organisations, national institutions and cetacean expert, supported international and national funding, and this effort displays clearly the necessity of regional – national cooperation in monitoring and subsequently conservation of migratory species, such as cetaceans, in the Mediterranean.
1152. Regional surveys, such as ASI, establish and represent an important effort to assess cetacean’s abundance and monitor trends through a coordinated and standardised system.
1153. GES could not be assessed for the CI4, since the baseline/reference values date recently (2018 – 2021), and there is no longer-time data series necessary for GES assessment. However, the next ASI project, planned in the scope of ACCOBAMS for 2024 – 2026 should contribute with a new set of data needed for the GES assessment in the scope of the 2029 Med QSR report.
Knowledge gaps for CI4
1154. There is still a disparity in research effort, with the most significant gaps in the southern part of the Mediterranean, which was also shown during the implementation of the ASI project.
1155. Long-term data series are missing, which would be based on systematic monitoring. For the Med QSR 2023 report it is understandable, since the baseline/referent values for cetaceans are determined only recently (2018 – 2021).
CI5 – Population demographic characteristics
1156. The attempt was made under UNEP/MAP to define GES assessment criteria for the CI5 – Population demographic characteristics, particularly baseline/reference values and thresholds, but it was not yet possible due to lack of data and knowledge in general (as elaborated in the 21WG.514/Inf.11).
1157. As currently defined under IMAP 2016, GES assessment for CI5 is based on measurement of human induced mortality. However, 21WG.514/Inf.11 proposes future reorganization and reformulation of GES definitions, notably to address human induced mortality under CI12 and to be more focussed on characteristics such as sex ration, calf production etc.
1158. Despite methodological limitations, the attempt was made to collect and process data on bycatch and strandings in general. Indeed, there are several regional data sources, notably: GFCM, ICES (for the EU Member States only) and MEDACES – cetacean specific regional strandings database under the auspices of SPA/RAC, management and support from the Spanish institutions.
1159. The collected data are very partial and unreliable, and in many cases, not regularly updated, and in general, bycatch is fairly underestimated.
1160. GES could not be assessed for the CI5 due to both lack of defined assessment criteria and lack of adequate data and information.
Knowledge gaps for CI5
1161. There is a lack of systematic bycatch data collection and lack of reliable data and information; biased estimates, only some data are reported.
1162. Stranding data are also not systematically collected, and even if they are available via MEDACES or other databases, there is a lack of information on the cause of the stranding, which would allow assessment of whether stranding occurred due to particular human activities or naturally.
1163. There is lack of (defined) thresholds for CI5, which is directly linked to lack of knowledge.
IUCN Assessment
1164. IUCN Red List assessment could be used as a valuable tool for assessing the state of cetaceans. As such, it is already linked to thresholds for CI4 under IMAP/GES assessment.
1165. Thanks to the two IUCN Red List assessments of cetaceans in the Mediterranean Sea, Black Sea and contiguous Atlantic area (ACCOBAMS area), performed in the scope of ACCOBAMS, in cooperation with IUCN and cetacean experts, several conclusions could be drawn both on the current status of cetaceans and their status trend since the mid-2000s.
1166. In general, the cetaceans (based on 8 GES assessment relevant cetaceans species) in the Mediterranean are significantly threatened, since the majority of species are assessed as Endangered (EN). There is improvement in the status of common bottlenose dolphin and striped dolphins, since previous assessments, which results were officially adopted in 2007 in the framework of ACCOBAMS as the IUCN Red Status List of Cetaceans in the ACCOBAMS area (Resolution 3.19)
1167. The knowledge of cetaceans has improved to a certain extent, which enables assessment of previously Data Deficient (DD) species such as Cuvier’s beaked whale and long-finned pilot whale.
1168. The status of fin whale has worsened compared to previous assessments, which results were officially adopted in 2007 in the framework of ACCOBAMS as the IUCN Red Status List of Cetaceans in the ACCOBAMS area (Resolution 3.19).
Knowledge gaps
1169. Although current knowledge enabled IUCN Red List Assessment, the data and information should be collected and processed through systematic monitoring at all levels (regional and national).
Measures and actions required to achieve GES for Cetaceans
· Understanding and addressing pressures/state of cetaceans’ linkages
1170. Continue the work on definition of pressures/cetaceans’ interaction hotspots; particularly extension of anthropogenic noise/cetaceans’ hotspots analysis to maritime traffic and identification of marine litter/cetaceans’ hotspots, as already envisaged in the ACCOBAMS Resolutions 8.17. and 8.20. respectively, both adopted by ACCOBAMS MOP 8 in 2022.
1171. Intensify efforts to improve knowledge on interrelations between climate change and cetaceans, including identification of sensitive cetaceans’ species and monitoring of their state related to climate change.
1172. Continue efforts in data collection and processing regarding the ship strikes, in cooperation with international organisations on marine traffic, notably IMO, as already included in the ACCOBAMS resolution 8.18.
1173. Develop techniques and models to assess cumulative/synergistic effects of pressures and impacts on cetaceans, including underwater anthropogenic noise, chemicals, marine litter, climate change and emerging pathogens, taking into consideration the existing recommendations (such as from the 2021 IWC Intersessional Workshop “Pollution 2025” etc).
1174. Intensify efforts to implement the existing pressures’ mitigation tools, such as guidelines and best practices already developed in the scope of ACCOBAMS, UNEP/MAP and IWC.
GES assessment
· Methodological issues
1175. Reformulate GES definitions and linked GES assessment elements under CI5, as proposed in the 21WG.514/Inf.11, notably to shift human induced mortality assessment to CI12 and focus on actual population demographic characteristics (sex ration, calf productivity etc).
1176. Define GES assessment criteria, particularly baseline/reference and threshold values, for CI5, as soon as sufficient data is collected/available. Possibly select representative pilot areas where adequate data could be collected on regular bases.
1177. Invest efforts in further quantification of thresholds for CI3.
1178. Encourage sub-regional level of cooperation between countries in reviewing and adjusting GES assessment criteria.
· Data collection, availability and GES assessment.
CI3 and CI4
1179. Replicate and conduct regularly regional synoptic surveys (ASI) (possible dates for ASI 2 – 2024 – 2026), and complement with other monitoring efforts, as already foreseen in the Long-Term Monitoring Programme (LTMP), adopted in the ACCOBAMS framework (Resolution 8.10).
1180. Continue to ensure ASI data availability and easy accessibility (in standard spatial GIS format) (as it is currently possible via NETCCOBAMS).
1181. Promote and support research of cetaceans in the southern Mediterranean, particularly in the areas that could not be covered by ASI.
CI5
1182. At the national level (or where possible at sub-regional level), establish or ensure functioning of the stranding networks, with the particular support of regional agreements/organisations (ACCOBAMS, SPA/RAC) in the segment of capacity building and application of new technologies, as already stipulated in the ACCOBAMS Resolution 8.15.
1183. Regularly submit national strandings data to MEDACES, including information on causes of mortality,
1184. Upgrade MEDACES and ensure MEDACES data availability and easy accessibility (in standard spatial GIS format) via MEDACES website.
1185. Intensify research efforts on population genetics, taking into account the ongoing work in the ACCOBAMS framework
(reference: ACCOBAMS Resolution 8.11).

E02 NON-indigenous Species
Common Indicator 6: Trends in abundance, temporal occurrence, and spatial distribution of non-indigenous species, particularly invasive, non-indigenous species, notably in risk areas (EO2, in relation to the main vectors and pathways of spreading of such species)
1186. Biological invasions are globally identified as one of the main drivers of biodiversity loss, with impacts ranging from loss of genetic diversity to native population losses, species displacements, habitat modifications and even whole ecosystem shifts (IPBES, 2019). Consequently, the role of non- indigenous species (NIS) as a pressure that threatens ecosystems is addressed in the framework of numerous policies and strategies worldwide. In the Mediterranean Sea and in the context of the Barcelona Convention, the Protocol concerning specially protected areas and biological diversity in the Mediterranean (SPA/BD Protocol) invites the Contracting Parties to take “all appropriate measures to regulate the intentional or non-intentional introduction of non-indigenous into the wild and prohibit those that may have harmful impacts on the ecosystems, habitats or species” (UNEP/MAP, 2017a).
1187. In the Mediterranean Sea, one of the most invaded ecosystems in the world (Costello et al., 2021), it is currently estimated that the number of NIS is in the range of 1000 with no sign of decline in their introduction rate. Recent work has demonstrated that, besides the unabated rate of new introductions, the rate of alien species spread and establishment is also increasing, with upwards of 70% of the introduced species being considered established (Zenetos & Galanidi, 2020; Zenetos et al., 2022a; b), causing the degradation of distinctive Mediterranean communities and habitats (Katsanevakis et al., 2014). In the western Mediterranean, negative impacts are caused primarily by invasive macrophytes, whereas in the Levantine and the Aegean Sea by fishes, and in the Adriatic Sea by introduced molluscs (Tsirintanis et al., 2022). Competition for resources, habitat creation/modification through ecosystem engineering, and predation are the primary mechanisms of negative effects of Mediterranean NIS. Pathway analysis has revealed that shipping, through ballast water and hull fouling, corridors, recreational boating and aquaculture transfers are primarily responsible for NIS introductions and spread in the region, while the ornamental trade and live food trade, among other activities, also contribute to NIS pressure (Katsanevakis et al., 2013, Tsiamis et al., 2018).
Methodology for data analysis in relation to CI 6
Following the recommendations in the document on Monitoring and Assessment Scales, Assessment Criteria and Thresholds Values for the IMAP Common Indicator 6 Related to Non- Indigenous Species (UNEP/MED WG.500/7, 2021), analysis of the temporal trends of new NIS occurrences was conducted at the subregional level. Thresholds and quantitative targets for GES have not been determined yet for CI6, but rather GES is based on directional trends, i.e., the reduction or minimization of the introduction and spread of NIS linked to human activities (see BOX 1). Consequently, trends in occurrence were analysed in two different ways. The first method involves breakpoint analysis in order to identify structural changes in the dataset, representing dates (i.e., years) when the mean introduction rate displays significant changes (increases or decreases). Breakpoint analysis was performed on the 1970-2011 time-series, i.e., excluding the 2012-2017 assessment period, with which comparisons are made. Once time periods with stable mean values were detected, 95% Confidence Intervals around the means were calculated as a measure of uncertainty. Subsequently, the mean NIS introduction rate of the 2012-2017 assessment period with its 95%CI was calculated and compared with the respective values of the breakpoint generated segments, providing a qualitative assessment (for details of the approach see Galanidi & Zenetos, 2022; Östman et al., 2020; Zeileis et al., 2003).
Species selection for spatial distribution maps
A small number of NIS with high impacts on a variety of habitats were selected for spatial distribution mapping. Starting from the CIMPAL evaluation of the 60 species in Katsanevakis et al. (2016), a shortlist of species was created on the basis of three criteria; habitats they invade, magnitude of impacts and introduction pathway. More specifically, the 13 habitat types examined by Katsanevakis et al. (2016) were merged into six broader habitat types, namely: estuaries & lagoons, Posidonia oceanica and other seagrass and seaweed meadows, coralligenous habitats, soft sediments (0-200 m depth), rocky substrates (0-200 m depth) and pelagic habitats (0-200 m).
Subsequently, NIS species with massive impacts on each of these habitats were marked and a subset was selected for mapping. Since many of these species have impacts on more than one habitat types, all broad habitat types were well represented in the final group of 10 species (Table 1).
Finally, primary and secondary pathways of introduction were examined for each species to ensure that all the major pathways are also sufficiently represented.
List of species selected for spatial distribution mapping. EC-Aqua = Escape from large aquaria (accidental), EC-Mar = Escape from mariculture, REL = Release (intentional), TC = Transport- Contaminant, UNA = Unaided, TS = Transport-Stowaway, TS-Shipping indicates both/either ballast water and/or hull fouling as vectors.
|
Habitats |
Species |
Pathway |
|
|
lagoons/seagrass/soft/rocky |
Lagocephalus sceleratus |
Corridor |
Unaided |
|
seagrass/soft/rocky/coral |
Pterois miles |
Corridor |
Unaided |
|
Seagrass/soft/rocky/pelagic |
Plotosus lineatus |
Corridor |
UNA |
|
lagoons/pelagic |
Mnemiopsis leidyi |
TS-Ballast |
Unaided |
|
lagoons/soft |
Callinectes sapidus |
TS-Ballast |
TS, UNA |
|
Soft |
Anadara transversa |
TS-Fouling |
TC |
|
seagrass/rocky/coral |
Acrothamnion preissii |
EC / TS- Angling |
TS-Shipping |
|
Rocky |
Codium fragile subsp. fragile |
TC |
TS-ball |
|
lagoons/seagrass |
Caulerpa taxifolia var. distichophylla |
EC-Aqua |
TS-angling, TS-hull, UNA |
|
lagoons/rocky |
Rugulopteryx okamurae |
TC |
|
Key Messages (Non-Indigenous Species)
1188. The results of trends analyses indicate that for the past 15-20 years new NIS introduction rates have been relatively stable in the West Mediterranean and the Adriatic, slightly but not statistically significantly increasing in the East Mediterranean but increasing in the Central Mediterranean. However, even if the rate is staying constant the total (cumulative) number of NIS in the basin is increasing steadily, with corridors and shipping the main pathways responsible.
1189. At the same time, there has been a notable increase in research effort and reporting, spurred by both policy requirements but also scientific interest coupled with citizen science initiatives, particularly in the southern Mediterranean. Consequently, clear interpretation of these trends is hampered by the lack of long-term standardised monitoring data, as it is not possible to disentangle the confounding effects of differential recording efforts spatially and temporally from real changes in pathway pressure or vector management.
1190. Nevertheless, a number of invasive, high-impact NIS have displayed an increased geographic expansion in the last decade or so, which can be deduced even behind the “noise” of increased detection and reporting. NIS species of warm affinities with long-range pelagic dispersal appear to have been favoured by climate change and increased seawater temperatures to penetrate the cooler regions of the Mediterranean, secondary anthropogenic dispersal however still plays an important role in the spread of the more sedentary species.
1191. To the extent that Good Environmental Status in relation to CI6 is defined as “Introduction and spread of NIS linked to human activities are minimised, in particular for potential IAS” it is concluded that GES has not been achieved in any of the Mediterranean subregions.
1192. Progress towards achieving GES requires coordinated actions by all the Contracting Parties (CPs) in order to mitigate and reduce invasion pressure. This is already considered by the draft updated Action Plan concerning Species Introductions and Invasive Species in the Mediterranean Sea, which, in conjunction with the Ballast Water Management (BWM) Strategy for the Mediterranean (2022-2027), place emphasis on preventative measures and activities to help CPs design and enact pathway action plans.
Good environmental status (GES) / alternative assessment (CI 6)
Descriptive characteristics of the entire baseline (1791-2020)
1193. At the pan-Mediterranean level, a total of 1008 validated, non-indigenous species have been found throughout the basin until the end of 2020, of which 143 are Macrophytes, 223 Mollusca, 188 Arthropoda, 172 Fishes, 29 Ascidiacea, 83 Annelida, 32 Bryozoa, 42 Cnidaria, 47 Foraminifera and 49 taxa belong to other taxonomic groups. Among the 1008 validated marine NIS, 742 are currently considered established, which makes the overall establishment rate in the Mediterranean Sea almost 74%. This value varies in the different subregions, with the lowest establishment rate in ADRIA (62%) and the highest in EMED (73%). When it comes to actual numbers, as expected, the eastern Mediterranean has the highest number of NIS with 788 species, followed by WMED (N=338), CMED (N=304) and ADRIA (N=211).
1194. During the validation process of the national baselines, 66 species emerged as data deficient: 59 characterised by divergence of opinion as to their alien or cryptogenic status and 7 as suspected questionable records. The highest number of species is observed in Israel and Türkiye, followed by Italy, Greece, Lebanon and Egypt, with values generally decreasing towards the Adriatic and western Mediterranean countries.

Figure 98: Number of NIS, cryptogenic (CRY) and data deficient (DD) species, detected in each Mediterranean country by December 2020.

Figure 99: Primary pathways of introduction of marine NIS per Mediterranean subregion. REL = Release in nature, EC = Escape from Confinement, TC = Transport-Contaminant on animals, TS = Transport- Stowaway (including Ship/boat ballast water, Hull fouling and Other means of transport), COR = Corridor, UN = Unaided, UNK = Unknown.
1195. Roughly half the non-indigenous species present in the Mediterranean have Corridor as their primary pathway of introduction, Figure). This number reaches 61% in the Eastern Mediterranean, but this pathway is not applicable moving westwards and northwards to the other subregions, where Lessepsian species migrate to a large extent by natural dispersal (pathway Unaided). CMED has the largest proportion of Unaided species (37%, 77% of which are Lessepsian species), as it accepts naturally dispersing NIS propagules from all other subregions. In the WMED, 24% of the introductions are Unaided (72% of which Lessepsian species), while ADRIA has the lowest percentage of Unaided species at 22% (of which 68% Lessepsian). Noteworthy also is the higher percentage of Contaminant species in ADRIA (21%) and the WMED (22%), which are inadvertently transported with aquaculture activities, while escapees have their largest representation in ADRIA, with 6 % of the species assumed to have escaped from mariculture or from non-domestic aquaria.
Intentional releases from domestic aquaria represent only 1-2% of all introductions, with the highest number of species appearing in the western and eastern Mediterranean. The two main shipping vectors together (i.e., Ballast water and Hull fouling) constitute the primary pathway for almost one third of the NIS entering the Mediterranean but as high as 49% of the NIS present in ADRIA.
1196. Figure 100 illustrates the gateways of new NIS records in the Mediterranean since 1988. The above pattern corresponds clearly to the pathways of introduction a) Indo-Pacific species invade [either freely moving via Corridor (Lessepsian NIS) or via shipping] and become visible firstly in the Levantine basin (Egypt, Israel, Lebanon, Syria, south Türkiye); b) accidental introductions with oysters appear in Thau lagoon (France), Venice lagoons (Italy), Ebro delta (Spain), Tunis lagoon (north Tunisia); c) vessel transferred species from the Atlantic are reported mostly from port areas e.g., Bay of Iskenderun, Izmir Bay, Türkiye; Saronikos Gulf (Greece) Gulf of Gabes (Tunis). Research effort and contribution of citizen science has revealed new species across the Mediterranean and has been particularly significant in reporting new records in previously unexplored areas such as Libya.

Figure 100: First new NIS records in the Mediterranean, observed between 1988-2017.
Temporal trends in occurrence
1197. Average NIS introduction rates per 6-year reporting period in the Mediterranean and its subregions between 1970-2017 can be seen in Figure 101.

Figure 101: Average NIS introduction rates in the Mediterranean and its subregions per 6-year reporting period between 1970-2017.
1198. Breakpoint analysis, carried out on the 1970-2011 subset with 2012-2017 as the assessment period, demonstrated that there are indeed different points in time when the NIS introduction rate significantly increased in each Mediterranean subregion, spanning from the mid-1990’s to the mid- 2000’s (Figure). During the almost 50 years of the analysed time period NIS introduction rates have more than doubled in EMED, CMED and ADRIA and almost doubled in WMED (Table 4). After the identified breakdates, introduction rates have remained stable in the western Mediterranean and the Adriatic but have markedly increased in the Central Mediterranean (Table 44). In the eastern Mediterranean new NIS records appear slightly elevated for the 2012-2017 period but the value still overlaps with the confidence intervals of the previous time segment (1997-2011).

Figure 102: Number of new NIS introductions per year (y-axis) in different Mediterranean subregions for the period 1970-2011 (continuous black line) with breakpoints and fitted mean values superimposed: vertical dashed line indicates breakpoint or year of significant change in the mean values of new NIS, with 95% confidence intervals around the breakdate (CIs) in red brackets; dashed green line shows the null model of no temporal change in new NIS numbers; and dashed blue line represents fitted mean values before and after the identified breakpoint.
Table 44
Results of the breakpoint structural analysis for each Mediterranean subregion for the period 1970-2011, with 2012-2017 considered as the assessment period. Segment yearly means are the fitted mean values of the yearly number of new NIS before and after the breaks, with 95% Confidence Intervals of the fitted means (95% CI) in parentheses. EMED = eastern Mediterranean (i.e., Aegean and Levantine), CMED = central Mediterranean (i.e., Central and Ionian Sea), ADRIA = Adriatic, WMED = western Mediterranean
|
|
Breakdate |
Segment yearly means (95% CI) Segment 1 Segment 2 Segment 3 |
2012-2017 mean (95% CI) |
||
|
EMED |
1996 |
6.9 (5.4, 8.5) |
15.6 (12.4, 18.8) |
na |
17.7 (11.1, 24.2) |
|
CMED |
2000 |
2.7 (2, 3.3) |
7.5 (6, 8.9) |
na |
12.5 (6.7, 18.3) |
|
ADRIA |
1991/2005 |
1.5 (1, 2) |
4.4 (3.4, 5.5) |
6.8 (3.8, 9.9) |
6.7 (4.9, 8.4) |
|
WMED |
2002 |
4.4 (3.5, 5.4) |
8.2 (5.4, 11.1) |
na |
8 (6.1, 9.9) |
1199. Linear regression was applied to the five 6-year reporting periods that span and capture the significant changes in NIS introduction rates in the 4 Mediterranean subregions (1988-1993, 1994- 1999, 2000-2005, 2006-2011, 2012-2017). The introduction rates (i.e., 6-year regression slopes) produced by this analysis are rather similar to the previous approach and reveal the same broad patterns in each subregion (Figure), the only difference being that comparisons between introduction rates of the last assessment period (2012-2017) and the rest of the timeline are not as straightforward to interpret with regards to GES targets due to short term fluctuations. Nevertheless, it is still evident that a significant increase in new NIS records occurred in the period between the mid-1990’s and the mid-2000’s in all Mediterranean subregions, with relatively stable rates from then onwards and no sign of decrease until 2017. On the contrary, there has been a significant increase in NIS introduction rates in the CMED after 2011 and a slight increase, albeit not statistically significant in the EMED.

Figure 103: Annual new NIS records (coloured symbols) for each Mediterranean subregion and the trends in cumulative NIS records (dark grey symbols and fitted lines) for the five assessment periods between 1988 and 2017. The equations from the linear regression models are displayed above the fitted curves; letters in parentheses indicate statistically different regression slopes (yearly introduction rates) i.e., slopes that belong to different letter groups are different at the 0.05 level of significance.
Trends in spatial distribution
Total xenodiversity
1200. An informative way to summarise the changes in the distribution of NIS at the total xenodiversity level is by employing Venn diagrams to visualise the overlap between NIS species in each subregion and how this has changed over time (Figure). The eastern Mediterranean contains the highest number of unique species, even though the percentage has declined from 69% to 50% since 1970. An overall decline in the proportion of unique species is also evident in the Western Mediterranean and the Adriatic but an increase is observed in the Central Mediterranean. Meanwhile, the total number of species shared among all subregions has risen from 6 in 1970 to 84 in 2020 (2.2% to 8.3% respectively), signalling the increasing homogenisation of NIS species in the basin.

Figure 104: Cumulative number of species that are unique to or shared between the 4 Mediterranean subregions in 1970, 2000 and 2020
1201. Distribution maps of selected species are displayed to give a general overview of their spread patterns over time. The associated frequency histograms (number of observations in each time bin) certainly highlight an increase in recording effort over the last 10-15 years but at the same time serve as an indication of the rate and intensity of dispersal. Lessepsian fish species (Figure105 to Figure 107), first appearing in the Mediterranean after 1990, are characterised by a typical progression from the southern Levantine northwards but then these patterns vary, depending on life cycle characteristics and environmental tolerances. Lagocephalus sceleratus, with adult active migration as well as pelagic larval dispersal, proliferated rapidly throughout the Levantine and the southern Central Mediterranean but also penetrated the Central Aegean during the warm summer of 2007 and reached the northern Aegean already in the 2006-2011 period. In 2012-2017 it expanded its distribution and has been slowly advancing in the Adriatic and the southern Western Mediterranean. Pterois miles was first recorded in Israel in 1991 (Golani & Sonin, 1992) but, with the exception of a single record in Greece in 2008, only started its invasion process after 2012. Until 2017 it had rapidly expanded throughout the Levantine and the southern Aegean, with sporadic records in the Central Mediterranean (Ionian coast of Greece, Sicily and Tunisia). In the last few years, being in the radar of Citizen Science initiatives as an emblematic and highly impactful invasive species (Galanidi et al., 2018), P. miles is characterised by a dramatic explosion of observations but more importantly it has penetrated into the Adriatic and is spreading north, an indication that its lower thermal tolerance limit is a critical factor for future spread (Dimitriadis et al., 2020). Plotosus lineatus, a venomous, swarming catfish, is a typical example of the boom-and-bust dynamics often characterising invasive species. After the first report in 2001 (Golani, 2002), it underwent a population explosion and rapidly expanded along the Israeli coast already by 2008-2011 (Edelist et al., 2012). [Note: the distribution records in the current map reflect geo- referenced data availability]. While the species remains widespread in the eastern Levant, its spread northwards has advanced at a slower pace, presumably due to the demersal nature and short duration of its larval phase (Galanidi et al., 2019). Plotosus lineatus is the first fully marine species to be included in the list of species of Union concern of Council Regulation 1143/2014 on IAS (EU, 2014).

Figure105: Distribution of Lagocephalus sceleratus in the Mediterranean Sea. First record(s) annotated with an asterisk, different colour symbols correspond to different 6-year reporting periods, corresponding frequency histograms depict number of records in each time bin.

Figure 106: Distribution of Pterois miles in the Mediterranean Sea. Details as in Figure105.

Figure 107: Distribution of Plotosus lineatus in the Mediterranean Sea. Details as in Figure105.

Figure 108: Distribution of Mnemiopsis leydyi in the Mediterranean Sea. Details as in Figure105.
1202. The distribution pattern of Mnemiopsis leydyi in the current map (Figure 108) is largely a result of the spatial and temporal distribution of recording effort, following distinct bloom events (e.g., more than 60% of all mapped observations stem from two data series, one from large scale surveys in the Northern Aegean between 2004-2010 – Siapatis pers.comm. to ELNAIS – and the other from sampling in the Northern Adriatic in 2016 – Malej et al., 2017). The species is clearly present throughout the basin, having arrived in the early 1990’s as a range expansion of a Black Sea population or with ballast water following its introduction into the Black Sea (Shiganova et al., 2001, Bolte et al., 2013) and subsequently spread in all subregions, aided by ballast water transport or unaided with water currents. Despite a considerable lag time from first introduction to population growth in the Mediterranean (Bolte et al., 2013), M. leydyi is undoubtedly established in most subregions.
1203. Callinectes sapidus is believed to have been introduced multiple times in the Mediterranean through a variety of pathways, among which ballast water transfer and accidental escape or intentional release through live food trade and mariculture are the most likely (Nehring, 2011). Even though sporadically recorded for decades, the species exhibited a massive proliferation in the last decade (Figure 109), including in the western Mediterranean, with increasing and invasive populations, and it is gaining commercial importance throughout the basin (Kevrekidis & Antoniadou, 2018; López and Rodon, 2018). Aside from natural dispersal, anthropogenic secondary introductions are suspected in many cases (Zenetos et al., 2020).
1204. Anadara transversa is a marine bivalve native to the Northwest Atlantic, that has been introduced to the Aegean and Adriatic Seas (Figure 110). Its first records from the Aegean Sea [Izmir Bay (Demir, 1977) and Bay of Thessaloniki (Zenetos, 1994)], were attributed to introduction in ships hulls. Very few records were reported until 2000 and then it was simultaneously found along a 200-km coastline from Venice to Ancona in the northern Adriatic Sea, its presence attributed to accidental introduction with oyster transfers. However, study of subfossil assemblages enabled Albano et al (2018) to disentangle the distinct stages of invasion of A. transversa. They concluded that the species was introduced in the 1970s but failed to reach reproductive size until the late 1990s because of metal contamination, resulting in an establishment and detection lag of 25 years. Very scarce records of the species exist after 2017 although the species is established in the Northern Adriatic. In fact, abundances reaching 42 ind. m−2 day−1 were documented in artificial collectors used for settlement analyses deployed at commercial mussel parks (Marčeta et al. 2022).

Figure 109: Distribution of Callinectes sapidus in the Mediterranean Sea. Details as in Figure 105.

Figure 110: Distribution of Anadara transversa in the Mediterranean Sea. Details as in Figure105.

Figure 111: Distribution of Acrothamnion preissii in the Mediterranean Sea. Details as in Figure 105.

Figure 112: Distribution of Codium fragile subsp. fragile in the Mediterranean Sea.
1205. Acrothamnion preissii is a tropical rhodophyte of Indo-Pacific origin that was first reported in the Mediterranean Sea in 1955 from Naples, Italy, introduced presumably with vessels (Figure 111). It has become invasive in many localities, particularly in the western part of the basin (Verlaque et al.2015). Its expansion in the Ligurian Sea in the 1994-1999 period may be linked to climate change in the 1980-90s (Bianchi et al., 2019). Acrothamnion preissi is classified among the ten worst invasive species in the Mediterranean, based on their negative impact score (accounting only for impacts on biodiversity) (Tsirintanis et al. 2022).
1206. The green alga Codium fragile subsp. fragile is a global invader that originates from NW Pacific that was first detected in front of the Banyuls marine station (France). A first wave of expansion took place in the period 1971-87 mostly in the northwestern Mediterranean and the Adriatic Sea (Figure 112). After that, a peak in number of occurrence records was observed between 2006- 2011 presumably due to scientific effort as well as to citizen science. Along the Spanish coastline in particular, this peak is related to some extent to long-term monitoring data availability. The species is easy to identify as it forms dense sponge-like fronds of low height that become a major structural element of the invaded habitat and dominate the macroalgal community and thus it is not a surprise that many of the latest records (2018-22) have come from citizen scientists reporting to inaturalist. Its introduction has been attributed to vessels but accidental introduction with oysters is also suspected. It appears to be absent from the south-east coasts of the Mediterranean, while in the Levantine Sea it was detected after 2000.
1207. The temporal distribution Caulerpa taxifolia var. distichophylla does not follow any obvious pattern but is rather a typical example of research effort combined with taxonomic expertise. Initially reported as C. mexicana from Syria in 2003 (Bitar et al. 2017) and as C. taxifolia from Iskenderun in 2006 (Cevik et al., 2007), identification of this slender Caulerpa taxifolia strain was proposed by Jongma et al. (2012). Subsequently in the period 2012-17 many records of the species have been published and this continued as the scientific effort increased in the Western and eastern Mediterranean populations of C. taxifolia var. distichophylla are probably the result of introduction events from southwestern Australia. Although the vector of primary introductions remains unknown (aquarium trade or shipping), maritime traffic appears to be the most likely vector of secondary dispersal. Caulerpa taxifolia var. distichophylla is closely related to C. taxifolia, hence interbreeding with the other C. taxifolia strains in the Mediterranean Sea might be expected to occur.
1208. With only one record since its first finding in 2002, presumably resulting from shellfish transfers, the brown alga Rugulopteryx okamurae was considered as locally established in France (Verlaque et al (2015). Following a record in Ceuta in 2015, a massive expansion was observed within the strait of Gibraltar and the Alboran Sea coasts of Spain in 2017 and the species became invasive in record time (García-Gómez et al. 2020). The lifecycle of this species, its ecological characteristics such as its euthermia and allelopathy as well and high competitiveness over other native and invasive species may be highly responsible of its invasive behaviour (García-Gómez et al., 2018). In the period 2020-21, R. okamurae extended its distribution in Morocco, France and Spain, reaching Madeira (Bernal-Ibáñez et al., 2022). In France, despite occurring for 20 years in the Thau lagoon, R. okamurae has not displayed an invasive behaviour in the area. Conversely, in Marseille, with the winter sea surface temperature usually above 13°C, this alga persists throughout the winter, and therefore, rapidly spreading when conditions are favourable (Ruitton et al. 2021). The new Commission Implementing Regulation (EU) 2022/1203 of 12 July 2022 amending Implementing Regulation (EU) 2016/1141 to update the list of invasive alien species of Union concern now includes Rugulopteryx okamurae.

Figure 113: Distribution of C. taxifolia var. distichophylla in the Mediterranean Sea. Details as in Figure 105.

Figure 114: Distribution of Rugulopteryx okamurae in the Mediterranean Sea. Details as in Figure 111.
Key findings for Common Indicator 6 (CI6): Non-Indigenous Species
1209. To the extent that Good Environmental Status in relation to CI6 is defined as “Introduction and spread of NIS linked to human activities are minimised, in particular for potential IAS” it is concluded that GES has not been achieved in any of the Mediterranean subregions. The results of trends analyses indicate that for the past 15-20 years new NIS introduction rates have been relatively stable in the West Mediterranean and the Adriatic slightly but not statistically increasing in the East Mediterranean but increasing in the Central Mediterranean. In none of the subregions has a reduction in new NIS introductions been observed based on data up to 2020. Furthermore, even if the rate is staying constant the total (cumulative) number of NIS in the basin is increasing steadily, with corridors and shipping the main pathways responsible. The appearance of some new NIS in each subregion is the result of range expansion from different subregions where they were initially introduced, as evidenced by the increasing proportion of NIS shared among all Mediterranean subregions. Nevertheless, and in contrast with the other subregions, the proportion of unique new NIS is steadily rising in the Central Mediterranean, thus the increasing new NIS introduction rates there cannot be solely attributed to natural dispersal from the other subregions. Furthermore, a number of invasive, high-impact NIS have displayed an increased geographic expansion in the last decade or so, which can be deduced even behind the “noise” of increased detection and reporting. NIS species of warm affinities with long- range pelagic dispersal appear to have been favoured by climate change and increased seawater temperatures to penetrate the cooler regions of the Mediterranean, secondary anthropogenic dispersal however still plays an important role in the spread of the more sedentary species.
1210. Clear interpretation of these trends is hampered by the lack of long-term standardised monitoring data, as it is not possible to disentangle the confounding effects of differential recording efforts spatially and temporally from real changes in pathway pressure or vector management. An additional challenge, also pertinent to the DPSIR analysis for NIS, is that spatially explicit, quantitative pathway pressure data are not uniformly available throughout the Mediterranean, such that any attempted correlations would be skewed or incomplete. This was already identified in UNEP/MED WG.502/Inf.11 (2021) and emerges as a priority in order to strengthen further GES assessments of CI6.
1211. Trends in abundance were not assessed as they require long time series of standardised monitoring data from the same locations, the collection and collation of which at the regional level is not sufficiently co-ordinated. Furthermore, an agreed methodology has not been developed for a formal quantification of changes in spatial distribution, which cannot be properly assessed without true presence-absence data.
1212. With regards to NIS impacts, even though assessment and mapping have been conducted at the regional level (Katsanevakis et al., 2014; 2016), there is plenty of scope for refinement and improvement as most reported impacts are still based on weak evidence (Tsirintanis et al., 2022). Thus, conducting manipulative and field experiments to examine impacts on species, habitats and ecosystems remains a priority for NIS research. Moreover, considering that species distributions have changed since the first Mediterranean-wide CIMPAL, but also new information has emerged regarding impact strength, NIS impacts need to be re-evaluated.
Measures and actions required to achieve GES for Common Indicator 6 (CI6): Non-Indigenous Species
1213. With regards to suitable data availability, the majority of the CPs have developed, and many are already implementing IMAP-compliant monitoring programmes. Furthermore, the IMAP Data and Information System is operational and has already started receiving NIS data, such that standardised time series are anticipated to be available for the next assessment cycle. This should make possible the formal quantification of abundance and spatial distribution changes and increase our confidence in the assessment of trends in temporal occurrence. If CPs have not already initiated the process, IMAP can assist in co-ordinating the development of priority NIS lists for monitoring of abundance through risk analysis and risk assessment. Early detection and early warning systems can be informed by regularly updating the spatial distribution information entered into MAMIAS and the IMAP Info System.
1214. Threshold values for trends in temporal occurrence have not been set yet but methodologies and approaches are under discussion through regional co-operation. Quantifying/modelling pathway pressure can assist in specifying quantitative targets (percentage reduction) by introduction pathway. Importantly, all these methodological steps need to be adapted for GES assessment at the national level. The effect of reporting lags on new NIS data and trends analysis in this assessment was circumvented by not using the data of the last 3 years (2018-2020), however it would be beneficial to adopt a commonly agreed methodology to deal with this issue in order to avoid loss of information.
1215. Next important steps for GES assessment of NIS include the elaboration of the remaining aspects of CI6 that relate to impacts, by further developing assessment criteria and quantitative targets for the most vulnerable/important species and habitats at risk. This is work that ideally should be co- ordinated with the implementation of EO1 Common Indicators CI1 and CI2 and EO6 on sea floor integrity.
1216. Besides methodological considerations with regards to IMAP and the assessment of GES, working towards achieving GES requires actions to mitigate and reduce invasion pressure, especially coordinated actions by all the states. Towards that effect, the draft updated Action Plan concerning NIS has already taken consideration the Mediterranean NIS baselines and the results of the MedQSR2023, such that in its proposed actions there is emphasis on preventative measures, including encouraging and facilitating CPs to strengthen their legislative and institutional framework in order to systematically risk assess and manage pathways, as well as elaborate early warning systems, rapid response plans and mechanisms to control intentional introductions. The other axis of focus of the Action Plan relates to the impacts of NIS, where targeted impact studies for priority species are proposed in order to identify density-response relationships and acceptable abundance levels. The implementation of the NIS Action Plan will progress in parallel with the Ballast Water Management (BWM) Strategy for the Mediterranean (2022-2027) which focuses on the management of ship- mediated introductions from ballast water, by facilitating the implementation of the Ballast Water Management Convention, and biofouling, by developing national strategies and action plans to manage this vector.

E03 Harvest of commercially exploited fish and shellfish
Methodology for data analysis in relation to E03
Assessment methods
The complete set of main fishery indicators adopted to assess current status of Mediterranean stocks as well as their temporal trend is reported in the last SAC Report (FAO, 2021). Below is a list of the ones for which a common methodology has been already developed (GFCM, 2017b) and discussed during the meeting of the Correspondence Group on Monitoring (CORMON), Biodiversity and Fisheries (UNEP/MAP, 2017a) as well as the 6th meeting of the Ecosystem Approach Coordination Group (UNEP/MAP, 2017b):
- Fishing mortality (F) and/or Exploitation rate (E) (Indicator assessment factsheet code EO3 CI7).
- Total Landings (TL) (Indicator assessment factsheet code EO3CI8).
- Spawning Stock Biomass (SSB) (Indicator assessment factsheet code EO3CI9).
Area
For the present analysis, the study area is corresponding to GFCM area of application (FAO major fishing area 37), in most cases with a focus on the Mediterranean Sea from the Straits of Gibraltar to Bosphorus, which comprises 27 Geographical Sub-Areas (GSAs) (Figure 115). Whenever possible, information was aggregated to provide a subregional (the Western, Central and Eastern Mediterranean and the Adriatic Sea; Figure 115) and regional outline of the status of resources. Stock assessments are mostly conducted by management units based on the mentioned GSAs. This method does not ensure that the whole stock is assessed, since stocks may cover several different management units. In some cases, when there is scientific evidence of a stock spreading through different GSAs, as well as information on species from different GSAs, existing information is combined across GSAs. This is then defined as a “joint stock assessment of a shared stock”.
Species
Special attention was given to priority stocks agreed upon by the GFCM (Table 45).
Table 45: Main species analysed in The State of Mediterranean and Black Sea Fisheries: priority species driving fisheries for which assessments are regularly (or planned to be) carried out.


Figure 115: Map of the GFCM area of application (Subregions and GSA- Geographical Subareas). Note; for the purpose of this QSR most of the analysis presented, with the exception to overall indexes as included in SoMFi (FAO 2022) include only the Mediterranean Sea.
1217. The indicators of Good Environmental Status of Commercially Exploited fish are quantitative proxies to describe the status of a specific fish stock (i.e. the fish population from which catches are taken in a given fishery) as well as the anthropogenic pressure imposed on it through fishing activities. These indicators are regularly used in fisheries management to assess the sustainability of fisheries, as well as the performance of management measures (Miethe et al., 2016), by monitoring how far the indicator is from previously agreed targets (i.e. reference points).
1218. The assessment of the size and state of exploited fish stocks is one of the pillars of fisheries management. Generally, stock status is determined by estimating both current levels of fishing mortality (EO3 CI7) and spawning-stock biomass (see EO3 CI9), and comparing these with reference points, which are typically associated with maximum sustainable yield (MSY – Brooks et al., 2010). 1219. Total catch refers to the total amount of fish of a commercially exploited fish and shellfish species taken by any fishing gear, while total landings (EO3 CI8) are the total amount of fish and shellfish landed and officially registered. Total catch is composed of total landings plus discards and unreported catches. As information on the latter quantities is fragmented, total landing is often used as a proxy indicator of fisheries production as well as of the removal of organisms from the ecosystem, although for areas where the latter are important a sizeable shift from real values may occur.
Key Messages (CI-7 Spawning stock biomass)
1220. While the biomass of some species under management plans is already increasing as a result of decreased fishing pressure, others have yet to show any improvement. Across the region, 44 percent of the stocks were found to have low relative biomass levels, with 19 percent intermediate and 37 percent high.
Key Messages (CI-8 Total landings)
1221. Capture fisheries production in the region has been stalled since the mid-1990s, with a decrease in 2020 likely exacerbated by the COVID 19 pandemic. Landings for the Mediterranean and the Black Sea (2018–2020 average) amount to 1 189 200 tonnes (excluding tuna-like species), very similar to the landings reported in The State of Mediterranean and Black Sea Fisheries 2020 (2016–2018 average). However, landings in 2020 show a 16 percent decline in comparison with 2019, likely related to some extent to the impacts of the COVID-19 pandemic on fleet dynamics, demand and trade. The total production for the Mediterranean Sea alone was 743 100 tonnes (62 percent of the total capture fish production in the region).
Key Messages (CI-9 Fishing mortality)
1222. The overexploitation of stocks has decreased over the past decade, with an accelerated reduction of fishing pressure in the last two years, particularly for key species under management plans. However, most commercial species are still overexploited, and fishing pressure is still double what is considered sustainable.
1223. Most stocks for which validated assessments are available continue to be fished outside biologically sustainable limits, and average fishing pressure is still twice the level considered sustainable (average F/FMSY = 2.25). Nevertheless, there has been a 10 percent decrease in the percentage of stocks in overexploitation since 2012 and a continuous gradual decrease in fishing pressure since 2012 (a 21 percent decrease since 2012, double what was reported in 2020).
1224. For some priority species under management plans, fishing pressure has declined by considerably more over the past decade, including European hake (-39 percent) and common sole (- 75 percent). However, fishing pressure continues to increase on certain other stocks, notably commercially important blue and red shrimp in the central and eastern Mediterranean.
Good environmental status (GES) / alternative assessment (EO3)
Spatial and temporal coverage of advice on stock status
1225. The number of non-deprecated validated stocks increased progressively between 2006 and 2020, peaking in 2020 with 99 in total; of these, since 2018, more than 75 percent were carried out in the terminal year (i.e. less than 25 percent of the assessments used are more than one year old) (Table 3), reflecting an improvement in spatial and temporal coverage. The percentage of catch assessed by the Scientific Advisory Committee on Fisheries (SAC) and the Working Group on the Black Sea (WGBS) reached 53 percent in 2015 (Figure 116), fluctuating between 30 to 50 percent since then, mostly due to the percentage of catch of key Black Sea small pelagic species, e.g. Black Sea anchovy (Engraulis encrasicolus ponticus) and sprat (Sprattus sprattus), whose landings are around 200 000 tonnes and 64 000 tonnes in 2021, respectively. Pending the finalization of a benchmark process, the last validated assessment for Black Sea anchovy was carried out in 2017, and therefore this assessment is considered deprecated in 2020, causing the percentage of catch assessed to fall below 30 percent.
The number of stocks for which advice was provided on a qualitative (precautionary) basis remained around 25 percent since the reference year 2018 (Figure 116), while the percentage of the catch assessed on a qualitative basis decreased from 14 percent to 8 percent over the same period. Status and trends of priority species.
Table 46: Number of validated and non‑deprecated stock assessments available per year, 2003–2020


Figure 116: Number of stock units and percentage of declared landings assessed per year, 2008–2020, with an indication of the quality of the advice emerging from the assessments.
1226. The overall increase in validated assessments compared to 2018 is consistent across all Mediterranean subregions. The central Mediterranean showed the steepest increase in the number of validated assessments since 2018, although the degree of increase varied among geographical subareas (GSAs) in the subregion (Figure 117). Coverage increased visibly in the central Mediterranean in GSAs 12–16 (northern Tunisia, Gulf of Hammamet, Gulf of Gabès, Malta and southern Sicily) and GSA 20 (eastern Ionian Sea) and in the Adriatic Sea (GSAs 17–18). Furthermore, GSA 5 (Balearic Islands), GSA 9 (Ligurian Sea and northern Tyrrhenian Sea), GSA 19 (western Ionian Sea), GSA 21 (southern Ionian Sea), GSA 24 (northern Levant Sea) and GSA 25 (Cyprus) increased by one stock assessed between 2018 and 2020, bridging the gap between areas with low and high assessment coverage in the GFCM area of application (Figure 117).

Figure 117: Number of validated stock assessments per year by GFCM subregion, 2008–2020
Overview of the status of stocks in the Mediterranean and the Black Sea
1227. Biomass reference points are not commonly available for assessed stocks. Therefore, the percentage of stocks fished outside biologically sustainable limits is mainly estimated by comparing the level of fishing mortality to the fishing mortality reference point. Most stocks for which validated assessments are available continue to be fished outside biologically sustainable limits (Figure 98). Nevertheless, there has been a 10 percent decrease in the percentage of stocks in overexploitation since 2012; in 2020, 73 percent of stocks were found to be outside biologically sustainable limits (the same value as in 2016 and the lowest since 2009) (Figure 98).

Figure 98: Percentage of stocks in overexploitation in the GFCM area of application, 2008–2020
Key findings per Common Indicator CI-7 (Spawning stock biomass)
1228. The overall analysis of the current biomass levels of Mediterranean stocks reveals a prevalence of stocks with relatively low biomass, although the percentage remains lower than the sum of the intermediate and high biomass percentages (Figure 99; Table 47).
1229.

Figure 99: Percentage of Mediterranean stocks at low, intermediate, and high relative biomass levels
Table 47: Relative biomass level by priority species and geographical subarea in the Mediterranean Sea

1230. A comparative analysis with the reference year 2018, based on the 45 stocks for which biomass information was available in both years, reveals that most stocks remain in the same biomass level group (30 stocks), while 10 stocks have dropped to lower levels of biomass and 5 stocks have improved (Figure 100). Notably, the relative biomass of deep-water rose shrimp in GSAs 9–11, as well as of European hake in GSAs12–16 appears to have declined in these two years, while European hake in GSAs 8–11, deep-water rose shrimp in GSA 5 and common sole in GSA 17 show improvements, among other stocks (Figure 7). Considering the comparable stocks between the current edition and previous edition (FAO, 2020), the decrease in stocks with a high relative level of biomass was partially compensated for by improvements in other stocks to the intermediate category.

Figure 100: Comparison of biomass levels between the previous and current edition of The State of Mediterranean and Black Sea Fisheries
Key findings per Common Indicator CI-8 (Total landings)
1231. Overall, total capture fisheries production in the Mediterranean and the Black Sea increased irregularly from 1 000 000 tonnes in 1970 to almost 1 788 000 tonnes in 1988. Total landings remained relatively stable during most of the 1980s, before declining abruptly in 1990 and 1991, largely due to the collapse of pelagic fisheries in the Black Sea. In the Mediterranean Sea, landings continued to increase until 1994, reaching 1 087 100 tonnes, and subsequently declined irregularly to 760 000 tonnes in 2015. Over the following three years, production reached 805 700 tonnes in 2018, but it notably decreased to 674 500 tonnes in 2020 (Figure 101). The drop in catch in 2020 was also likely exacerbated by COVID-19 restrictions, which not only included temporal closures on fishing activity, but also led to a decrease in demand linked to the nearly total shutdown of tourism and impacts on trade (GFCM, 2020a, 2020b). The combined average landings for the Mediterranean and the Black Sea over the 2018–2020 period amount to 1 189 200 tonnes (743 100 tonnes in the Mediterranean, accounting for 62.5 percent of the total, and 446 100 tonnes in the Black Sea). This value is slightly higher (1.1 percent) than the catch from the 2016–2018 period, with a decrease of 5.7 percent in the Mediterranean Sea and an increase of 15 percent in the Black Sea.

Figure 101: Total landings in the Mediterranean and the Black Sea per year, 1970–2020
1232. The main species groups comprising Mediterranean Sea landings show very similar percentages in calculations for the whole GFCM area of application, except for “Clams, cockles, arkshells” (2.7 percent in the Mediterranean Sea and 4.6 percent in the whole GFCM area of application) and “Abalones, winkles, conchs”, which are not present in Mediterranean Sea catches. Nonetheless, the contribution of small pelagic species (i.e. the combination of “Herrings, sardines, anchovies” and “Miscellaneous pelagic fishes”) is moderately lower (52.4 percent of Mediterranean landings versus 63.4 percent of total GFCM area of application landings). A slight increase is noted for “Miscellaneous coastal fishes” (5.1 percent more than in the whole GFCM area of application) and “Squids, cuttlefishes, octopuses” (2.8 percent more) (Figure 102).

Figure 102: Total landings by main species group in the Mediterranean Sea, 2018–2020 average.
1233. In the Mediterranean basin, sardine (14.8 percent) and European anchovy (22.4 percent) continue to be the most prevalent species, together accounting for 37.2 percent of total landings (in line with data from the period 2016–2018, which also showed a large diversity of species significantly contributing to the catch, i.e. 17 species accounting for at least 1 percent of total landings) (Figure 103).

Figure 103: Total landings by main species contributing at least 1 percent of the total catch in the Mediterranean Sea, 2018–2020 average.
1234. The breakdown of capture fisheries production by GFCM subregion is here reproduced on the basis of the available landing data as transmitted by countries to the GFCM through the DCRF (Task I “Global figures of national fisheries”, Task II.1 “Landing data” [operating vessels by GSA and fleet segment] and Task II.2 “Catch data per species” [total catch by GSA and fleet segment for main commercial species]) for the period 2018–2020.

Figure 104: Total landings by GFCM subregion, 2018–2020 average
1235. In general, the dynamics reported in The State of the Mediterranean and Black Sea Fisheries 2020 (FAO, 2020a) continue to hold true, with the large majority of the catch in each subregion being declared by countries belonging to this subregion and only a few cases of fleets from countries outside the subregion contributing a small percentage of its total catch (Figure 105). In the western Mediterranean, Algeria (39.5 percent) brings in the largest share of landings by weight, followed by Spain (29.2 percent) and Italy (16.3 percent). The three together account for 85 percent of all landings in the subregion, with Morocco, France and “Others” contributing the remaining 10.3 percent, 4.6 percent and 0.1 percent, respectively. In the Adriatic Sea, landings by weight are dominated by Italy (54.7 percent) and Croatia (41.3 percent), which account for 96 percent of all landings in the subregion, followed by Albania (3.4 percent) and “Others” (0.6 percent). In the central Mediterranean, landings by weight are dominated by Tunisia (59 percent), followed by Libya (18.5 percent) and Italy (16.5 percent), the three of which account for 94 percent of all landings in the subregion, followed by Greece (4.5 percent) and “Others” (1.5 percent). In the eastern Mediterranean, landings by weight are mostly split between Greece (37.7 percent), Türkiye (29.4 percent) and Egypt (27.9 percent), which together account for 95.1 percent of all landings in the subregion, followed by “Others” (5 percent).

Figure 105: Average annual landings by country in each GFCM subregion, 2018–2020
1236. In terms of species contributions to the landings of the different subregions (Figure 106), sardine is the main captured species in the Adriatic Sea (64 900 tonnes, 42.5 percent), the western Mediterranean (49 500 tonnes, 18.2 percent) and the central Mediterranean (16 800 tonnes, 8.9 percent), while European anchovy is the predominant species in the eastern Mediterranean (17 900 tonnes, 13.5 percent) and the Black Sea (123 000 tonnes, 72.1 percent). In the western Mediterranean, European anchovy (36 200 tonnes, 13.3 percent) and sardinellas nei (Sardinella spp.) (25 500 tonnes; 9.4 percent) are the second and the third main species, whereas the remaining 59.1 percent (160 700 tonnes) corresponds to a large number of species contributing to the catch in this region (Figure 106).
1237. In the central Mediterranean, other prevalent species are European anchovy (13 800 tonnes; 7.3 percent), sardinellas nei (13 400 tonnes; 7.1 percent), deep-water rose shrimp (9 900 tonnes; 5.3 percent) and common pandora (9 000 tonnes; 4.8 percent). The sum of all other species, each of which contributes less than 5 percent of the total, constitutes the remaining 66.6 percent, at 125 300 tonnes (Figure 106). In the Adriatic Sea, four species, namely sardine (64 900 tonnes; 42.5 percent), European anchovy (24 900 tonnes; 16.3 percent), striped venus clam (16 100 tonnes; 10.6 percent) and European hake (3 700 tonnes; 2.4 percent), account for 71.8 percent of the landings. The sum of all other species, each of which contributes less than 5 percent of the total, constitutes the remaining 28.2 percent, at 43 000 tonnes (Figure 106). In the eastern Mediterranean, sardine (10 900 tonnes; 8.2 percent), marine fishes nei (9 400 tonnes; 7.1 percent) and sardinellas nei (8 300 tonnes; 6.3 percent) are the other prevalent species, with all others together accounting for the remaining 64.9 percent with 85 900 tonnes (Figure 106).

Figure 106: Average annual landings of the main landed species in each GFCM subregion, 2018–2020
1238. Overall, the diversity of species in the catch is much higher in the central, eastern and western Mediterranean (roughly 44 species). In comparison, the lowest number of species that can be summed together to account for 90 percent of the total catch in the Adriatic and the Black Sea is smaller (slightly less than 20 for the Adriatic and less than five for the Black Sea).
1239.

1240. Figure 107
Figure 107: Number of species or species groups accounting for 90 percent of the total catch of each GFCM subregion, 2018–2020
Key findings per Common Indicator CI-9 (Fishing mortality)
1241. Overall, fishing mortality for all species and management units combined continues to be more than twice the target (Table 4). However, there has been a 21 percent reduction in this ratio since 2012 (when it was nearly three times higher), with the current ratio (F/FMSY = 2.25) representing the lowest of the time series. The highest average values of exploitation ratios are found for blue and red shrimp (Aristeus antennatus), followed by European hake and some small pelagic species, e.g., sardine (Table 4). Most of the highest values (i.e., fishing mortality higher than four times the value of FMSY), have been found in the western Mediterranean for European hake, blue and red shrimp and red mullet.
1242. European hake deserves a special mention as this species has experienced a very large reduction in F/FMSY throughout the Mediterranean Sea, excluding the western Mediterranean where some very high ratios are still found (Table 4). In detail, the average overexploitation ratio (F/FMSY) of European hake in the region has declined by 39 percent since 2013, although it remains on average four times higher than the reference point.
1243. A total of 16 stocks show exploitation rates below FMSY (although some show very low biomass and are still considered to be overexploited); of these, the majority are found in the western Mediterranean, while the central Mediterranean hosts only one stock with exploitation rates below the reference point (Table 4).
Table 48: Exploitation ratio (F/FMSY) by priority species and geographical subarea, with average value per species

1244. Overall, all priority species with enough available information show an improved situation concerning fishing pressure in comparison with the previous edition of The State of Mediterranean and Black Sea Fisheries (FAO, 2020). Blue and red shrimp presents an exception, with average fishing pressure having steadily increased since 2015, as well as deep-water rose shrimp, which shows an overall stable fishing pressure at nearly twice the level considered sustainable (Figure 108). In contrast, European anchovy shows a general decreasing trend in its exploitation ratio, driven also by low exploitation ratios in the western Mediterranean. The exploitation ratios of sardine across the Mediterranean are characterized by high variation and the average exploitation ratio steadily increased until 2018, at which point the trend reversed, again owing to low exploitation ratios of stocks in the western Mediterranean (Figure 108). Among demersal species, previously observed decreasing trends in exploitation ratios for European hake and common sole (Figure 108) are showing a reduction of 75 percent since 2011, and European hake showing a reduction of 39 percent and 62 percent, respectively, since 2013. The fishing mortality of deep-water rose shrimp has increased by 3.5 percent since its lowest level in 2017 (F/FMSY = 1.71). Likewise, blue and red shrimp continues to show a rather significant increase in its exploitation ratio (F/FMSY = 4) since a lowest recorded value in 2015 (F/FMSY below 2), coupled with increasing catch. Finally, the catch of Norway lobster has decreased since 2017, as has the exploitation ratio (34 percent decrease) (Figure 108).

Figure 108: Trends in the exploitation ratios (F/FMSY) of select priority species until 2020
Measures and actions required to achieve GES in relation to EO3
1245. The percentage of stocks with validated assessments has continued to increase since the last edition of The State of Mediterranean and Black Sea Fisheries (FAO, 2020a), particularly in the western Mediterranean, as has the geographical coverage of assessments. Nevertheless, efforts are still required to extend assessment coverage to all GSAs, while the decrease observed in the percentage of landings assessed highlights the need to ensure the regular assessment of key stocks with high landings.
1246. Results show that since 2012, the average fishery exploitation ratio in the Mediterranean has consistently decreased. However, in the Mediterranean Sea, the percentage of stocks with low biomass remains high, although lower than the cumulative percentage of stocks with intermediate and high biomass. Low biomass in an overall scenario of decreasing exploitation rates may be explained by either a delay in the response of stock biomass to declining fishing pressure or a reduction in fishing pressure insufficient to promote a recovery of biomass, or both. In the reference year 2020, 87 percent of the stocks assessed in the GFCM area of application were of medium- or long-lived demersal species, which may require several years to show an observable response in biomass.
1247. A number of stocks of priority species (e.g., European hake in the Strait of Sicily, and common sole in the Adriatic Sea) have consistently shown improvements in their exploitation ratios over recent years. In contrast, the decrease in the exploitation ratio observed for a number of hake stocks (e.g. in the Tyrrhenian Sea and the Strait of Sicily) is not matched so closely by corresponding increases in biomass; this disparity not only reflects the different biological characteristics of the two species, but also serves as an important reminder that early signs of reversing the trend in fishing mortality should not be taken as a guarantee of sustainability (Figure 109).

Figure 109: Annual progression in biomass (B/BPA) (right) and exploitation ratio (F/FMSY) (left) for European hake in the Tyrrhenian Sea and the Strait of Sicily
1248. Conversely, blue and red shrimp shows an increasing trend in exploitation ratio, though this observation rests on an overall lack of assessments, as only seven stocks have been assessed to date, mostly in the western Mediterranean. Along with a lack of information on the origin of catch in the eastern-central Mediterranean, this shortcoming has hindered a fully informed implementation of the multiannual management plans and management measures in place in the Ionian Sea, Levant Sea and the Strait of Sicily, respectively.
1249. The positive signs for fishing pressure provided by this overall analysis are most likely related to the adoption of a significant number of national and regional management measures in the recent past, underpinned by an increase in the quality and coverage of scientific advice, particularly on priority species and key fisheries. Measures consist of adopting multiannual management plans that include effort control measures and/or the introduction of quota-based management for some species, as well as the establishment of fisheries restricted areas (FRAs) and spatio-temporal limits to protect essential habitats and life stages. Nevertheless, the slow recovery in biomass of certain key stocks and the need to honour the objectives of the GFCM 2030 Strategy for sustainable fisheries and aquaculture in the Mediterranean and the Black Sea point to the importance of continuing to implement an effective and generalized management framework, including through strengthening existing management plans and defining new ones, as well as ensuring the effective implementation of those in place. Since 2018, research programmes have been incorporated, through specific recommendations, into the GFCM workplans for the Mediterranean. Research programmes share the common aim of improving the scientific basis for the provision of advice on existing and potential management measures through dedicated actions towards increasing the quality and quantity of information on resources and addressing previously identified knowledge gaps and shortcomings in relevant scientific or technical advice. More recently, research programmes have been complemented by pilot studies and projects. Pilot studies and projects rest on similar principles, i.e. conducting scientific data collection and analysis on specific themes, fisheries or species, but have a more limited geographical and temporal scope. In all cases, the core principle is to take full advantage of ongoing research at the country level by providing experts with a regional platform for coordination, knowledge exchange and capacity building enriched by new activities developed based on common methodologies. The data collected through these initiatives are generally aimed at providing the scientific basis for determining the most appropriate management measures for selected fisheries.
1250. The advice on the status of Mediterranean commercially exploited stocks, as provided by the GFCM SAC have largely improved in recent years, as recognized by Mediterranean riparian states. However, the level of information differs between species and geographical areas, with information concentrating on a few stocks and lacking or being fragmented in other commercially exploited stocks.
1251. The correct estimation of fishing mortality requires a precise understanding of riparian states’ fishing capacity. Due to the specificities of the Mediterranean fleet, composed of a large majority of small-scale polyvalent vessels, information on fishing capacity is sometimes incomplete or inaccurate. Furthermore, the estimation of robust reference points for fishing mortality requires the use of long time series and the incorporation of environmental and ecosystem variables, as well as the design of robust methods that can integrate information from different sources.
1252. Even if stock assessments and advice are now available for an increasing number of stocks, the number of stocks for which MSY-based SSB reference points (or its proxy) exist is still very limited. Thus, it is not possible to establish reproductive potential levels relative to MSY, and the indication on current biomass levels is often based (as in this assessment) on an empirical analysis of often short time series.
1253. The update and adoption of new specific binding recommendations related to the mandatory requirements for data collection and submission, underpinned by the GFCM Data Collection Reference Framework (DCRF) has greatly improved the quality of the data in support of advice, in line with the need expressed by riparian states. The GFCM 2030 strategy for sustainable fisheries and aquaculture in the Mediterranean and the Black Sea is also contributing in this endeavour through specific actions such as, for example, the execution of harmonized scientific surveys-at-sea.
Total landings
1254. The correct estimation of total landings requires a precise knowledge of the fishing activities carried out by the active fishing fleet operating in the Mediterranean. The specificities of the Mediterranean fleet, composed by a large majority of small scale polyvalent vessels, as well as the existing variety of landing sites, and the different capacity of Mediterranean riparian states to accurately monitor the landings in such sites, make difficult an accurate estimation of landings in the region.
1255. Furthermore, Illegal, Unregulated or Unreported (IUU) fishing activities in the area also affects the estimates.
1256. Ultimately, the ideal indicator for the production of fisheries as well as the removal of organisms due to fisheries should be total catch, but information on discards is still fragmented, despite large efforts are being deployed for the implementation of discards monitoring programmes across the region under the hat of the GFCM 2030 strategy for sustainable fisheries and aquaculture in the Mediterranean and the Black Sea.
1257. The GFCM has proposed a number of solutions to improve the quality of the estimation of total catch. On one hand, the GFCM DCRF provides the technical elements to improve and harmonize the collection of information on fisheries throughout the Mediterranean and on the other the GFCM 2030 strategy provides an effective instrument to guide an increase in the collection of sound information (e.g. bycatch monitoring programme and a survey of small-scale fisheries), as well as the implementation of dedicated actions to assess and curb IUU fishing, which are expected to largely improve the quality of the estimates for this indicator.
1258. Care needs to be taken in interpreting trends in the indicator for total landings because variations in total catch/landing may be a result of various factors, including the state of the stock, changes over time in the selectivity of fishing gear, changes in the species targeted by fishing activities, as well as inconsistencies in the reporting.
